English Français

1-877-967-2726

The Physics of Kawhi Leonard’s Incredible Buzzer Beater

It was the shot heard across Canada.  There were a lot of factors that made Kawhi’s buzzer beating basket so remarkable.  Aside from there being no time left on the clock and the weight of a sport’s nation on his shoulders, Kawhi had to overcome the backward momentum that is inherent in a ‘fadeaway’.  The purpose of a fadeway is to create space between the shooter and defender(s), which was a necessity for Kawhi as there were several seriously tall 76ers trying to screen his shot.

Over-coming the fadeway’s backwards momentum is no easy feat as it requires players to quickly calibrate in their minds the additional force that is required to successfully sink a basket, which for most mere mortals is not intuitive.  The shot is so challenging that only a handful of NBA basketball players have been able to reliably make this shot; and we’re talking the great players such as Michael Jordan, Lebron James, Kobe Bryant and of course Kawhi Leonard.

The video below provides an extreme example of backwards momentum with a soccer ball shot from the back of a truck

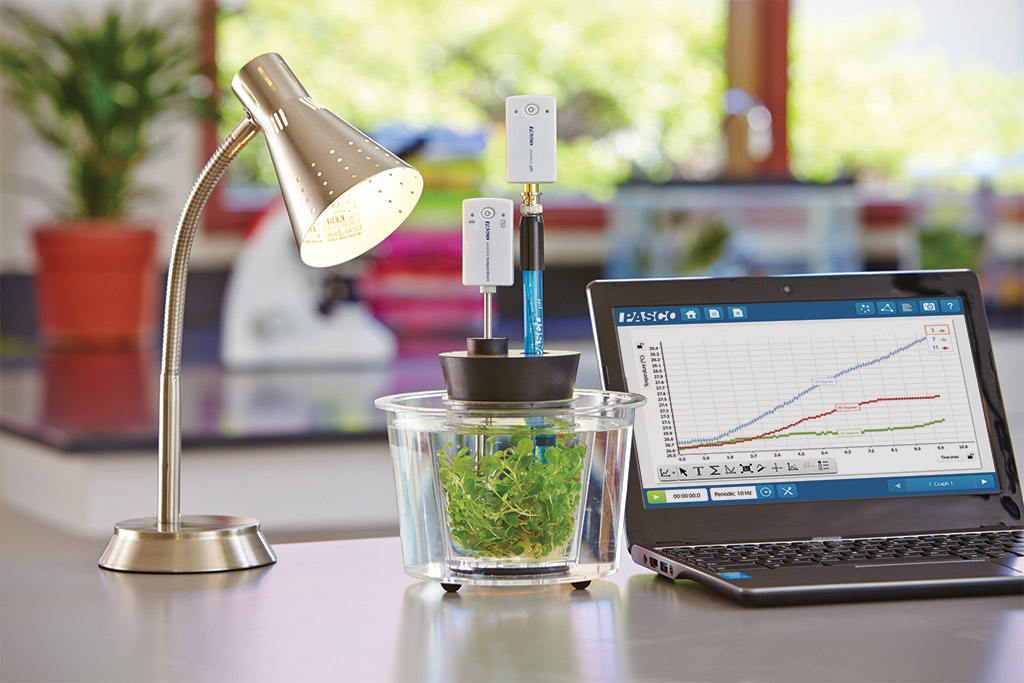
Investigating Kawhi Leonard’s shot in the lab

In addition to backwards momentum there were many additional physical factors at play such as the angle of the shot and gravity.  Investigating all these forces in a single activity would not be practical.  Fortunately most of these forces can be isolated and explored in the lab using PASCO sensors, software and/or equipment.

Exploring The fadeaway’s negative momentum using PASCO

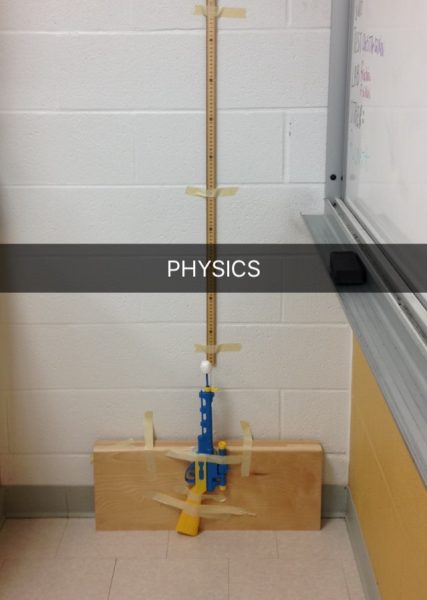
PASCO offers an intriguing and affordable solution to model the dramatic effect of a fadeaway’s negative momentum on projectile distance.  PASCO’s mini launcher will consistently launch projectile balls the same horizontal distance for a set angle, assuming that the launcher is stationary.  If however, the launcher is placed on PASCO’s frictionless cart, the force of pulling the trigger will cause the cart to move backwards at a velocity that can be measured using the motion sensor.  Students will be surprised to see that even though the cart travels just a few centimeters, the overall projectile distance is significantly reduced.  This can be a very simple demonstration or an in-depth quantitative analysis that factors in the projectiles initial angle and velocity, the time of flight and even the k-constant of the spring.

Other Forces Affecting a Basketball Shot

Momentum and Explosions

When a basketball player takes a jump shot (as with a fadeway), the player and the ball could be viewed as 2-object linear system if you ignore other outside forces such as gravity.  What’s interesting, and perhaps not apparent to many students, is that the basketball will exert an equivalent force to the player as the player is exerting on the basketball (Newton’s 3rd Law).  Of course because of the very significant inertia (mass) difference between the two objects, the basketball will accelerate at a much fast rate than the player.  The player however will experience some acceleration in the opposite direction to that of the basketball.

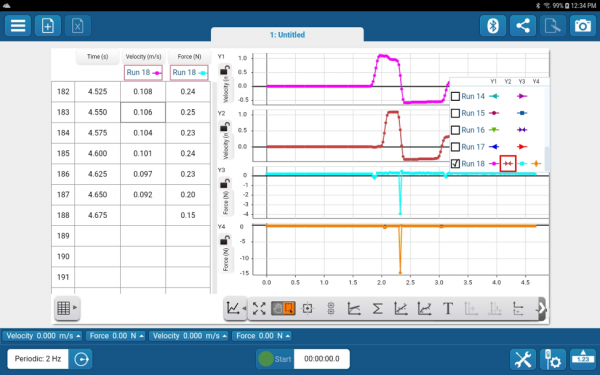
Using Smart Carts to explore Momentum and Explosions (Free Lab)

The Wireless Smart Carts are equipped with an exploding plunger.  Multiple 250g bars can be added to one cart to skew the masses.  The velocities of both carts are measured using the cart’s internal position sensors enabling students to determine that momentum is conserved in a linear exploding system.

ME-1240 Smart Cart (Red)

ME-1241 Smart Cart (Blue)

ME-6757A Cart Mass (set of 2)

Newton’s Third Law

The player’s force on the basketball will be equal to the opposing force of the basketball onto the player.  Of course most students will consider this a ridiculous proposition until they prove this for themselves.

Using Smart Carts to explore Newton’s Third Law

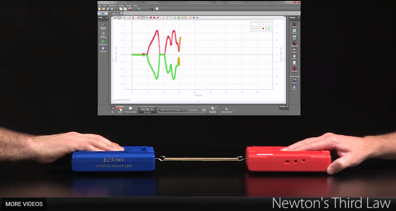
There are several ways the carts can be used.  The simplest activity is for two students to have a tug-of-war using the internal force sensors of two Smart Carts and an elastic band as depicted in the image.  The equal but opposite forces will be confirmed, however in relation to a basketball player taking a shot, it has some shortcomings as the forces are pulling as oppose to pushing.

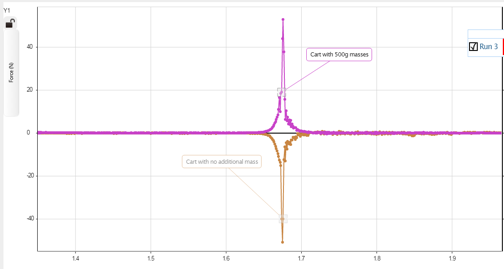
An equally simple activity, and one more relevant to the basketball shot scenario, is to collide two Smart Carts (with magnetic bumpers attached to their force sensors).  As both carts have equivalent masses, students may not be surprised to see the impact forces are identical.  However, what will probably surprise your students, are the force measurements that occur during a collision when one cart is weighed down with one or more 250g masses.  Using their intuition, most students will speculate that one of the carts will experience a much greater force than the other.  Of course, Newton’s 3rd Law will triumph and the forces will be identical.


Gravity

What goes up must come down.  This is true of course for all earth bound objects (including basketballs) due to the ever present force of gravity.  Without gravity the trajectory of a basketball player’s shot would be straight to the ceiling of the arena, where most of the fans would be viewing the game.

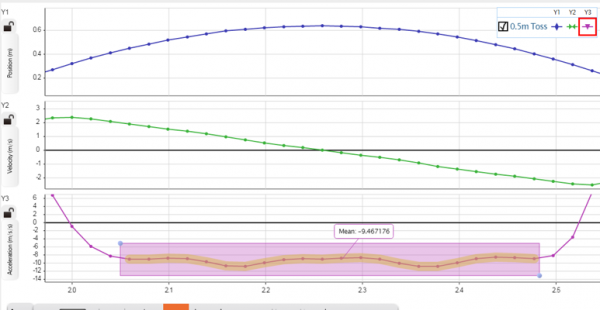
Exploring the accelerating force of gravity using the Motion sensor

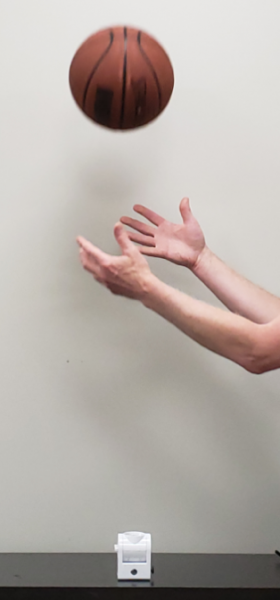
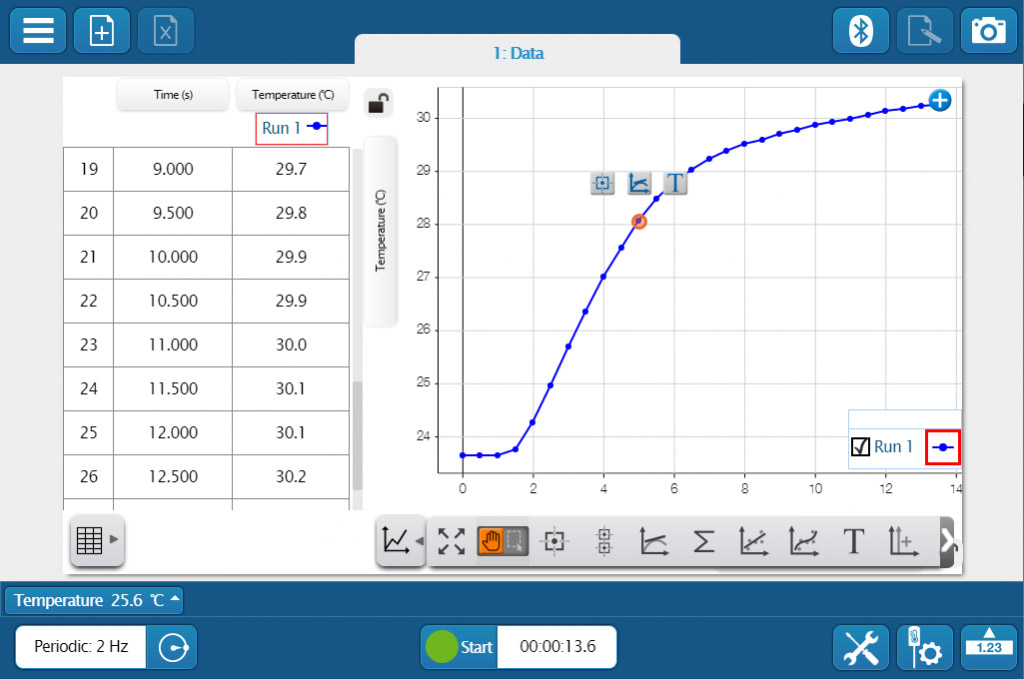
PASCO offers several technologies and techniques for measuring gravity including the Wireless Smart Gate and Picket Fence and the new Freefall apparatus.  Both of these techniques are accurate and precise means to measure gravity.  A third technique and one more appropriate for relating to a basketball shot is to measure the position of a vertically tossed ball and then have the software derive an acceleration graph from this data.  Statistics, including the Mean of the acceleration plot can be calculated by the software for the period when the ball was in freefall as shown in the graph.


The average acceleration in the free fall period is approximately -9.5 m/s/s


Included Products:

Explorations in Photosynthesis and Respiration

Originally posted on PASCO’s Blog. Blog is written by Bruce Taterka a teacher at West Morris Mendham High School in New Jersey

PASCO’s Wireless CO2 Sensor provides a powerful opportunity for students to explore the effects of photosynthesis and respiration in their local environment. This blog will describe how students can use a “Pretzel Barrel CO2 Chamber” to design experiments to measure rates of photosynthesis and respiration in a wide variety of settings and circumstances.

Background

Soil plays an important role in the carbon cycle and global climate because it acts as a carbon sink, sequestering CO2 from the atmosphere in the form of organic matter. The upper layers of soil contain organic matter that is actively decomposed by the soil community: microbes, insects, worms and other animals.

While respiration by soil organisms decomposes organic matter and releases CO2, the plant community is photosynthesizing and taking in CO2 from the atmosphere. So in this part of the earth’s carbon cycle, CO2 is moving in two directions – into the atmosphere from soil, and out of the atmosphere into plants. We refer to this transfer of carbon as “CO2 flux.” With PASCO’s Wireless CO2 Sensor, students can explore the carbon cycle, plant and soil biology, and climate change by measuring CO2 flux.

The rate of CO2 flux depends on a wide variety of factors. For soil, the rate of CO2 production may be affected by:

  • The content and type of organic matter in the soil
  • Temperature
  • Moisture
  • Sunlight
  • Soil chemistry

For the plant community, the rate of CO2 production may be affected by:

  • Type and density of plants
  • Temperature
  • Moisture
  • Sunlight
  • Soil chemistry

Carbon flux will vary with the weather, throughout the day, and the year as the season’s change. Measuring CO2 flux provides an excellent jumping-off point for engaging in NGSS practices regarding the earth’s carbon cycle.

Creating a model of the Earth’s carbon cycle
Figure 1. Collect data, and construct explanations. Integrating a range of analytical results can form the basis for creating a model of the earth’s carbon cycle and designing solutions to problems such as climate change and food production.

Students can define their research questions and problems, analyze the results, and generate designs to conduct a variety of controlled experiments using the chamber. Most experiments will identify the CO2 concentration inside the chamber as the dependent variable and will test the effect of an independent variable of students’ choice.

On land, students can compare CO2 flux on soil, lawn, forest, sunny vs. shady areas, and in a wide variety of other situations. In general, when the chamber is on bare soil or leaf litter, the CO2 concentration inside the chamber will be expected to increase, usually within a short period such as 5 or 10 minutes. Figure 1. For longer investigations, the sensor can be placed in logging mode (storing data to internal memory) and left for ~24hrs before the batteries will be depleted.

Logging Mode Video


The chamber can be placed over plants that can fit inside it, in which case CO2 concentration inside the chamber should decrease, although it may be counteracted by respiration. The chamber can even be used on water by wrapping a piece of foam insulation around it, allowing it to float.

In any type of environment, students can design their studies to investigate the effect of different variables on CO2 flux.

How to make a Pretzel Barrel CO2 Chamber

The chamber is made of a plastic pretzel container available in supermarkets.

  • Draw a straight line around the container, then cut it in half using a razor knife to form two large plastic chambers open at the bottom and closed on top.
  • You have two options here. You can cut a hole in the top for a CO2 sensor using an electric drill or a razor knife. The hole should allow the CO2 sensor to fit snugly, keeping the container airtight; the hole can be adjusted with tape if necessary to create a tight seal around the sensor. Alternatively, the sensor can be placed inside the container since it’s wireless!
  • The chamber is now ready to be used by placing it on top of soil and measuring CO2 flux.

For aquatic environments, wrap a piece of foam pipe insulation around it.

The Joy of Lab Design

I’ve been a theorist and an experimentalist at different times throughout my career.  When at university, theory won out over experimental but now, as a teacher of high school, experimental easily wins.  There is nothing like watching students figure out problems, deduce scientific laws and test theories.  The old problem was the equipment.

What can I do with ticker-tape?

How responsive are the thermometers?

How reliable is the data?

How big are the errors?

Is it going to work?

But now, with my PASCO equipment, things are changing.  I’m more excited and so are my colleagues.  The students are picking up on that excitement too.  The labs we’ve done for decades are being updated.  However, the real joy is in designing new ones.

Since September I’ve created three new labs besides updating the other eight I do.  One for kinematics, one for gravity and one for momentum.  The momentum one is great because we were never able to do a reliable lab before.  Using the Smart Carts and Sparkvue the kids are designing safe barriers and analyzing crashes.  My favourite part of that lab is having the students figure out if movies are lying to you when they show a person getting shot, flying backwards through a window, and landing a few metres on the other side of it.  We can recreate the situation with the Smart Cart acting as the bullet and looking at the forces involved.

This screenshot represents a head-on collision between two smart carts.  They were released at different times to offset v-t graphs.

As I was working on the design of the labs and testing them out, my colleagues and administration stopped by.  They all wanted to see what I was up to.  They could see my excitement.  They were infected.  Two team members went away and started designing their own labs.  We are talking more, sharing more and the kids benefit from it.

We can ask deeper questions because the data is more reliable and relatable.  We can do so much with the carts and are figuring out more each time.  Labs in physics 12 were hard because of analysis to 2-D.  We are creating labs for them.    The goal is a least two new labs a month.  The labs are also not so cookie-cutter.  They don’t always have to be quantitative.  They are exploring more and, hopefully, learning more.

All of this is possible because of the Smart Carts, Sparkvue and the joy of lab design.


Just another day in the lab…

The bell rings.  Time to start class. 

We are doing another lab today and today we will use the new technology!  Cheers erupt from the class.

Yes, for today’s lab there will be no ticker tape.  No counting dots!  Welcome to SPARKvue!  Everybody turn on your Sparks and open the software. 

Mr. Grant?  Mine says it needs a software update.

Go ahead and do it.

It won’t let me.

Oh, right.  I go over and update.

Turn on your smart carts and connect them to SPARKvue.

Mine says it needs a firmware update.  Mine too.  And me!

Of course.  Update all using my phone as it is faster than trying to get the Sparks to do it for some reason.

Are we ready?  Allow the carts to roll down the ramp freely.  Take data of time, position and velocity.  Graph velocity vs time.  What sort of shape are we looking for?

Straight lines!

Good.  Go for it.

Mr. Grant.  We aren’t getting any data.

Is it recording?  The button changing from green to red and back again?

Yes.

Let me try…hmm…you are right.  Let me see…Oh.  You switched it to manual recording.  Set it to periodic and try again.

Still nothing.

Let me see again.  You have a frequency of 1 Hz.  The cart is going too quickly to get data.  Change your frequency.  Is everybody else getting data?

Yes.  Sure.  My button isn’t responding.

Try a lighter touch.

Now it is.

Do around 50 runs.  Figure out which run is your best one and why.

Does the whole graph need to be straight?

What do you think?

No…?

Right.

Once you have your best run copy down the table and then graph it.  Your graph on paper should resemble the one on the Spark.

Do we need to copy down all the data?

How much do you have?

150 points.

<sigh>  What do you think?

No…?

Why not?

That is more than need to show the pattern?

Good.

Time to put the equipment away.  Please make sure it is turned off.  What did we think about the new way of doing the lab?

Updates were frustrating.

Granted.

Took us a while to get used to it.

Fair enough.

Still way better than ticker tape though.

Good.

SPARKvue 4.0

SPARKvue makes data collection and analysis easier than ever before with cross-platform compatibility on Chromebooks™, iOS, Android™, Windows®, and Mac®, or on our standalone datalogger, the SPARK LXi.

Why SPARKvue?

SPARKvue makes data collection, analysis, and sharing quick and easy on every platform. Compatible with all of PASCO’s wireless and PASPORT sensors, students can quickly set up their lab, or use a built-in Quick Start Lab and begin collecting data immediately. SPARKvue is for all sciences and grade levels. However, if you’re an advanced user looking for more capabilities such as video analysis, advanced statistics and calculations, and greater customization of data displays on a PC or Mac®, then check out our PASCO Capstone™ software.

Since SPARKvue was first released, it has been winning awards, and we never stop improving it. With the latest major release of SPARKvue 4, we’ve continued to add features without adding complexity. A new Welcome Screen makes it easy to get started and discover SPARKvue’s capabilities. Whether you want to add data manually, use sensors for real-time or remote logging, or open one of the hundreds of existing labs, this is your starting place.

SPARKvue Landing Page Example

Data Collection

Using a USB or an interface, with SPARKvue you can just plug-and-play with nearly one-hundred sensors via Bluetooth®, which pairs wireless sensors through a simple in-app list (no system settings are required). PASCO understands that classrooms and labs can be hectic, so SPARKvue allows you to simply select a sensor from the sorted list (the closest sensors are first) and match a 6-digit laser-etched ID number to get connected. This method works even when there are dozens of Bluetooth sensors in the same lab.

Once you’ve selected a sensor, choose from a template or QuickStart Experiment, or you can build a page to meet your needs. SPARKvue is designed for inquiry, and students are not constrained to a few pre-selected layouts… the software can support expanding capabilities with ease.

SPARKvue Connection Screen Example
SPARKvue Template Screen Example

Collecting and visualizing data is easy with an array of displays, and the tools you need for analysis are right at your fingertips. Students can annotate data, apply curve fits, compare runs, create calculations, and much more! In-context tools make it simple to find what you’re looking for, which means that students spend their time learning the science, not the software.

SPARKvue Data Screen Example
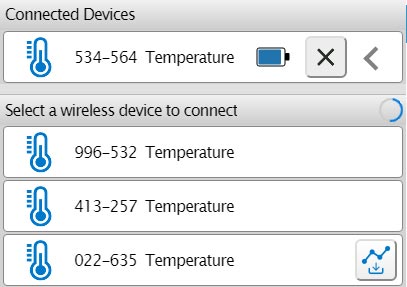
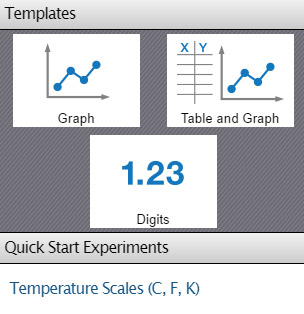
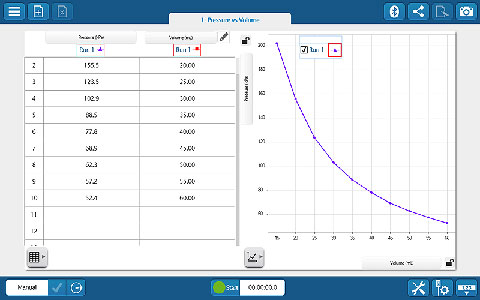
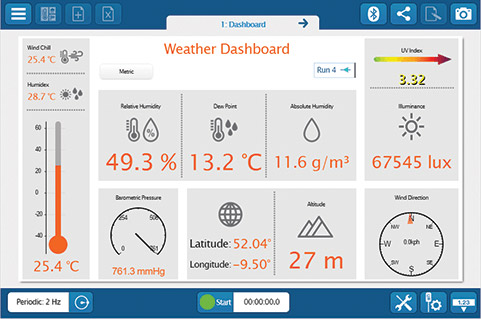
Whether you’re teaching K–8, high school, or college students, SPARKvue has the displays and tools you need to collect and analyze data. The basics you’d expect (such as digits, meter, graph, and table) are all included, but you will also find FFT, bar graphs, map display, embedded assessment questions, video playback, image capture, and analysis, as well as space for text and images. The labs you can build are only limited by your time and creativity.

Data Sharing and Export

When it’s time for students to submit their work, SPARKvue supports a variety of formats, and its export tools make it easy for educators. Students can easily snapshot their work in SPARKvue and submit an image, export the data to a .csv file to work in a spreadsheet, or save it in our .spklab format when they can come back and do more work in the future. SPARKvue also supports many other apps for saving or sharing data, including Google Drive on Chromebooks™.

SPARKvue Sharing Screen Example
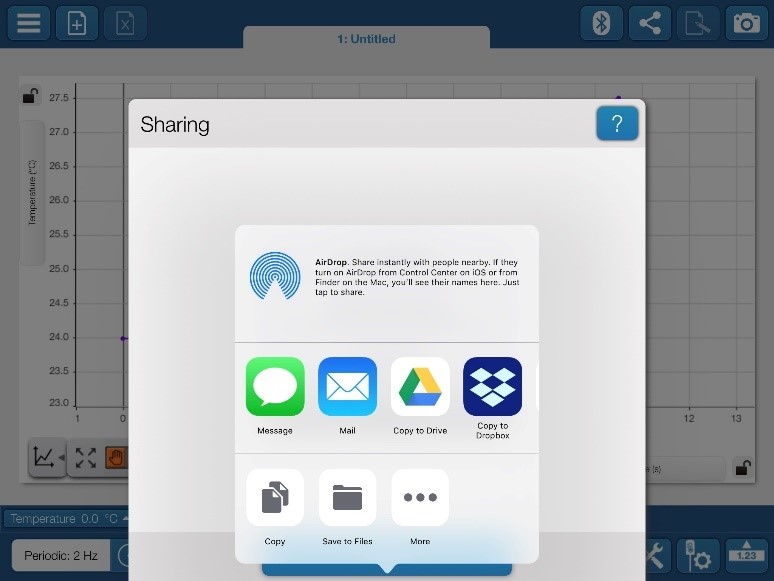
If students are collaborating on a lab activity across devices, they can set up a shared session and stream results in real-time. Then, when the session is over, each student will have a copy of the data to analyze independently. These sessions can be set up in seconds within a student group, or the entire class can share the data from a teacher demonstration.

SPARKvue Data Screen Example

Data Collection

  • Live Data Bar: See sensor readings before you start sampling.
  • Periodic sampling: Automatic sampling proceeds at a fixed rate.
  • Manual sampling: Saves data only when a user specifies.

Data Displays

  • Graph, including multiple plot areas and axes.
  • Digits
  • Meter
  • Data Tables
  • FFT
  • Map Display
  • Bar Graph
  • Weather Dashboard (when used with the Wireless Weather Sensor with GPS)

Analysis Tools

  • Scale-to-fit: Adjust axis for optimal view of the data.
  • Data Selection: Easily select a portion of the data for analysis.
  • Prediction Tool: Visualize a prediction alongside the data.
  • Smart Tool: Find data point coordinates and calculate delta values.
  • Calculations Tools for Statistics: Easily get basic statistics (min/max/mean) and more.
  • Slope Tool: Find the slope of a point.
  • Curve Fits: 10 different curve fits with goodness of fit values.
  • User Annotation: Easily add text annotations to runs or points.
  • Easily add a y-axis or a new plot area.
SPARKvue Data Collection Example

Designed for Science Learning

  • Convenient annotation, snapshot, and electronic journaling are among the features that support peer dialogue, classroom presentations, and assessment.
  • Create and export electronic student lab journals.
  • Integrated with cloud-based file-sharing services such as Google Drive, Dropbox, and more.

The Same User Experience Across:

  • Computers
  • Chromebooks™
  • Tablets
  • Smartphones
  • PASCO dataloggers

More Features

SPARKvue Graph Data Screen

Graph data from a sensor & see the results in real-time.

SPARKvue Meter Screen

A Bar Graph used to investigate absorbance.

SPARKvue Boyles Law Screen

Boyle’s Law using both manually entered & sensor data.

SPARKvue Weather Dashboard Screen

Weather dashboard to monitor atmospheric conditions.

SPARKvue Choose a Path Screen

The new entry screen makes getting started even easier. Choose from three entry paths.

Download:

Download the latest update or give it a try for free.

Windows® Computers

  • Filename: SPARKvue-4.3.0.10.exe
  • Filesize: 250.32 MB
  • Version: 4.3.0
  • Released: Dec 13th, 2019

Download Free Trial Download Update

Mac® Computers

  • Filename: SPARKvue-4.3.0.10.dmg
  • Filesize: 132.67 MB
  • Version: 4.3.0
  • Released: Dec 13th, 2019

Free Apps for iPhones, iPads, Android tablets and Chromebooks

These SPARKvue apps provide the complete software install so that the user experience is the same regardless of platform. Updates for these apps are handled via direct notification and installation on your device, including SPARK LX/LXi users.


System Requirements

Windows
  • Windows 7 SP1 or later
  • Processor: 2 GHz or greater
  • RAM: 2 GB or greater
  • Disk Space: 459 MB or greater
  • Resolution: 1024 x 768 or greater
Mac
  • Mac OS X v 10.11 or later
  • Processor: 1 GHz or greater
  • RAM: 2 GB or greater
  • Disk Space: 202 MB or greater
  • Resolution: 1024 X 768 or greater
Chromebook
  • Chrome OS v70 or later
iOS
  • iOS v9 or later. Compatible with iPhone, iPad, and iPod touch.
Android
  • Android v5.0 or later. Compatible with tablets or phones.

About The Free Trial

  • This is a fully-functional 60-day free trial of SPARKvue software for Windows or Mac Computers.
  • After the 60 day trial, a licensed version of SPARKvue will be required to continue.
  • The full version of SPARKvue is also available as a free app for iPads, Android tablets, and Chromebook devices.

The View From a Small Town Physics Classroom

Let me paint you a picture. Not something physicists normally do but I’ll give it a shot.

I teach in a small town in BC. For most of my career it has been lower on the social-economic scale, a true blue-collar place but things are changing. More and more people are being pushed out of the big cities due to high house prices and ending up here where life is more laid back, more affordable, more idyllic?

Again, for most of my career the supplies I have had access to are the same supplies that came with the school when it was built…back in the 1950s. Trying to modernize my lab has been a challenge but just like the city, things are changing.

I’ve used PASCO products since my university days and have always found them to be intuitive and practical. When I had the chance, I purchased some of their GLX data loggers for demo purposes. I started to show the students the power of probeware and they yearned for more. Yes, I used yearn to describe students. I know, almost unheard of.

When I procured the funding to buy a class set of the GLXs after buying one a year for 5 years I was ecstatic. I called PASCO to order and was told that they were discontinued. I was bummed. What now? They told me about their new product, the Spark LX as a tablet data logger. I was intrigued. Many discussions happened, and I started to get on board. PASCO even took some of my suggestions about what I thought the logger should entail. After months of waiting they finally arrived; just in time for the start of a new school year.

I happily got to setting them all up and preparing their first interactions with the devices. I would use the Match-Graph software to give my physics students some hands-on real life to graph interactions. After a few hiccups of the airlinks needing firmware updates which my school computer wouldn’t allow I had the students head out into the school to test out the Spark and the software.

The looks we got from the other students and staff started as bewilderment. “What is his class up to now?” was heard more than once. My students didn’t even hear. They were too engaged to notice. The beginner graphs which were too hard mere seconds ago were now too easy. Harder graphs please. Harder and harder they went and the more competitive they got. “I’m addicted to this!” one student exclaimed. “I get it now.” Yelled another. They were hooked at first use.

I can’t wait to see how the next experiment goes. This is how technology should work in class. Relating physical experience to life experience to learning.

____
Glenn Grant has been teaching physics, math and science for 20 years in a small town called Mission, BC. 
“For most of my career I’ve been using equipment from the 1960s. I was the first person in my district to start using a Smart Board and then started getting into sensors about 10 years ago.  Since then I’ve cobbled together whatever I can to give my students access to something from the current century.  I believe that technology has a place in the classroom as a tool to further the learning.  Using the new PASCO equipment we can do labs 100 times a class and the discussion becomes more in-depth.  Why did they choose the data set they are using?  What makes that data “better”?  Can you replicate the graph on the board using the equipment.  It allows for more actual science than just content memorization. As I deepen my understanding of the equipment and its uses, I’ve been teaching the other members of my department and other teachers in the district.  I’m not an expert yet but I’m working on it.”

ONE SENSOR, MANY POSSIBILITIES

Earlier this year PASCO released a new Wireless Weather Sensor. It collects temperature, humidity, UV, wind, and more. The sensor also has a GPS! The folks at PASCO then embedded ArcGIS into their SPARKvue software that manages the sensors and allows for data analysis and visualization. Of course you can always export your data and load into a map at ArcGIS.com.
The all-in-one instrument can record up to 17 different measurements individually or simultaneously! Use the sensor in logging mode with the optional Weather Vane Accessory for long-term monitoring, or use it as a hand-held instrument to study microclimates and record ambient conditions relevant to many biological and environmental phenomena.
The Wireless Weather Sensor covers a wide range of protocols including:
  • Air Temperature
  • Barometirc Pressure
  • Water Vapor
  • Relative Humidity
  • Surface Ozone
  • Aerosols
  • Biometry
  • Lilac Phenology
  • Seaweed Reproductive Phenology
  • Hummingbird Project
  • Phenological Gardens
  • Land Cover Sample Site
  • Fire Fuel
  • Mosquito Larvae Protocol
  • GPS

The Effect of Learning Through Inquiry: A Blog Series

Who am I?

Hello World! My name is Maayan, and I am another co-op student at AYVA. I’m currently studying biochemistry at the University of Guelph, which is how I ended up on the AYVA Team. A bit more about me: I do not have any cute pets, but I do have two younger brothers. I’m interested in science, especially all the cool discoveries that can be made to improve the human condition. Outer space is rad. I can talk about Mars colonies for hours on end.

How did I get into science?

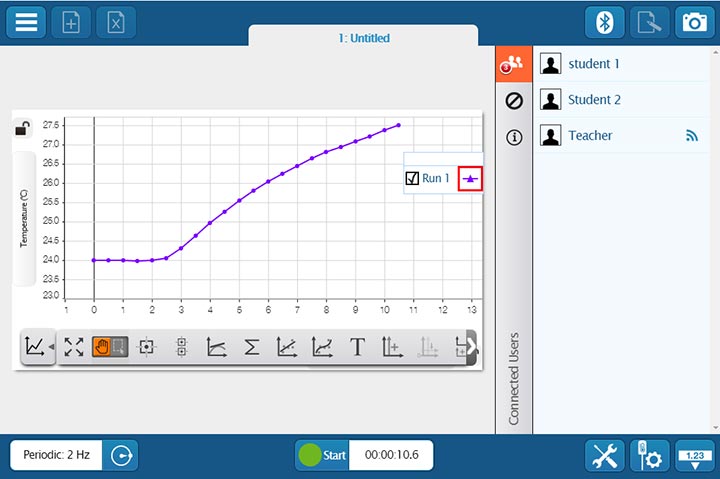
As a wonderfully sweet little child, I frequently stole my brothers’ toys. I built Lego castles, controlled toy cars, and appropriated (stole) puzzles by the box. I liked building things, and I liked breaking things down to see how they worked. As I continued to grow into an adolescent, I enjoyed reading science fiction, enough to finish all the books my school library had.

Eventually, as I skipped on through life, I was assigned to do a school project on an important Canadian. I chose Julie Payette, an astronaut (and currently the Governor-General), and my interest was born. It was amazing to me that people had gone to the moon, and now different countries were collaborating on the International Space Station for scientific research. For the first time, I felt that people could come together for a cause to further humanity. The five-dollar bill is still my favorite: it has the Canadarm2 and the astronaut on it. To this day, I smile whenever I see one.

In high school I realized that astronauts couldn’t have gotten to space without a team of people down on earth who helped solve problems, and just because their jobs were less flashy (and got less camera time) it did not mean that they were any less important. Anyway, I liked biology (humans!) and enjoyed learning chemistry (and about the universe). I couldn’t decide which one I liked better, so biochemistry is the major I chose. No one seemed to be offering xenobiology or astrobiology courses at the time, but I hope someday they will.

What’s Next?

Back to the blog, I will be writing a few articles on teaching science through inquiry. This is important for future STEM-ists since teaching STEM is only a step before understanding STEM. After all, every inventor, scientist, engineer, mathematician, technologist, and astronaut started as a student.

Nice to meet you, and I hope to write again soon,

Maayan

GLOBE Learning Experience 2018

Every 4 years, GLOBE hosts their annual conference outside the USA and this year we trekked to Killarney, Ireland to work with GLOBE coordinators, teachers, and students from all over the world. The conference began with an opening ceremony at the Killarney House which offered an incredibly scenic exhibit venue.

GLOBE 2018 setup

For the next several day’s attendees used PASCO equipment at two field sites to collect water quality data on the Owengarrif River. Sampling took place at the Upper Torc above the falls and the Lower Torc at the mouth of the river.

GLOBE 2018 data

Having downloaded SPARKvue software to their phone or tablet the students and teachers connected to the Optical Dissolved Oxygen, Wireless pH, and Wireless Conductivity sensors to complete the Water Quality Protocol. We also deployed the new Wireless Weather Sensor which made the site set up a cinch, answering the two critical questions of “Where are we?” and “What are the current conditions?” right on the weather dashboard display.

While the map display is not required for this protocol being able to view the data in real-time on the map was helpful to give students a sense of the landscape and identify features that could impact the water quality. Happily, at every site, we sampled the Owengarrif was in good health, although it was running near-record low flow rates due to a 5wk drought and above-average temperatures.

Here’s a quick video of highlights during the conference – hopefully, we’ll see you there next year!


If you’re already a GLOBE teacher or PASCO user and want to see what protocols are supported with sensors, please visit our GLOBE page for an updated alignment. If you’d like to learn more about how to participate in the GLOBE program and get your students collecting data that will be used by scientists all over the world, please visit GLOBE.gov to get started.

Inquiry Learning Helps Keep Students in STEM

The use of technology in STEM education is quite important because it supports inquiry learning. With the newest innovations from science equipment companies such as PASCO, there are even more ways to support inquiry using hands-on learning. In several independent studies, using inquiry-based learning has improved student confidence, interest, and performance in physical sciences.

The Impact of Inquiry Learning for Science Students

One study in Thailand by Tanahoung, Chitaree, Soankwan, Manjula and Johnston (2009) compared two first year introductory physics classes at the same university. One class was taught using a traditional method while the other class used Interactive Lecture Demonstrations. Interactive Lecture Demonstrations is a form of inquiry; students first predict the outcome of an experiment individually and then in groups. The demonstration is performed in real-time using micro-computer based laboratory tools (in this case a PASCO interface and a temperature sensor) and then students and/or instructor reflect on the concept based on their predictions and the actual results. For each thermodynamics concept, a pre-lecture and a post-lecture test was administered for comparison.

Tanahoung et al. found that in almost all of the concepts, there was a greater increased of percentage of correct answers between tests from the experimental group than the control group. These results show that teaching methods that use inquiry and technology are a novel and viable pedagogy for the 21st century.

Inquiry-based learning has been shown to improve grades in physical science courses for non-STEM students. In one particular study by Hemraj-Benny and Beckford (2014), a chemistry concepts such as light and matter was taught in relation to visual arts using a combination of traditional lectures and inquiry activities. The experimental group participated in group discussions, performed experiments using worksheets, created presentations, and had a summary lecture from the instructor. In contrast, the control group only had lecture-style lessons in which the instructor went over PowerPoint slides and certain scientific experiments in detail.

As a result, the class that received both inquiry and traditional lessons performed better in their final exam than the control group. More students in the experimental group reported better confidence and less fear in science than the control. Interestingly, Heraj and Beckford found that both the control and experimental group reported to have a greater appreciation of the scientific world after completing this course. Overall, this experiment shows that inquiry methods are especially beneficial for non-STEM students in understanding physical sciences. The critical skills taught in this course is an excellent example of how STEM skills can benefit everyone, including non-STEM majors.

The use of personal multifunctional chemical analysis systems has greatly improved student perception on chemistry experiments. As reported by Vanatta, Richard-Babb, and Solomon (2010), West Virgina University switched to the PASCO SPARK learning system and reported several benefits to using such systems like “less ‘waiting around time’” (Vannatta, Richard-Babb & Solomon, 2010, p. 772), the possibility of interdisciplinary and field experiments due to the versatility of using such equipment. Such as portability, ease of use and using microcomputer-based laboratories allows students to move at their own pace instead of waiting for others to move on. All of these benefits are factors to increased student retention and interest in chemistry majors.

Additionally, PASCO has upgraded from the portable SPARK learning system with built-in software to the downloadable SPARKvue software for computers and mobile devices. In another study, Priest, Pyke, and Williamson (2014) compare student perception using a handheld datalogger (the PASCO GLX system) versus SPARKvue on a laptop for the same chemistry experiment. Students were surveyed after using the GLX system for a vapour pressure experiment on their opinion on the lab. The next year, the school had phased out the GLX system and introduced SPARKvue using a laptop interface but kept the lab exactly the same. Researchers noticed more positive responses to the experiment when students used the laptop interface. Students perceived that the experiment was simpler and that the content was easier to understand when using SPARKvue because students are more familiar with a laptop and not a traditional datalogger, they experienced less frustration and spent less time learning how to use the necessary software to gather data.

A Guided Inquiry Lab – Results May Vary!

In my own studies, I benefited from inquiry labs and technology definitely made these labs easier. One of my favourite labs was a dart gun experiment where our groups were challenged to determine the theoretical spring constant of a dollar store dart gun by devising our own method. The goal of the experiment wasn’t to determine the actual spring constant since there weren’t actual springs in the dart gun, but to use what we knew from other units to create an experiment. We were given free reign over all the equipment in the classroom including the PASCO GLX and motion sensor and needed to keep a lab notebook in order to note any changes to the experimental method.

My partner and I opted for a low-tech option (pictured right) – we weighed the dart and determined the maximum height of its flight upwards so we could plug it into a kinematics equation to find the vertical velocity of the dart when it exited the chamber. This method was sort of tedious – I would launch the dart from the floor while my friend would video the dart on her phone while standing on a chair so we could replay and record when it reaches maximum height. This resulted in a few mishaps such as the dart perfectly falling into the adjacent broken glass box which we promptly moved. We also had to make several modifications to our experiment design to ensure that our data collection was consistent such as taping the dart gun so it exits perpendicular to the ground and adding weight to the dart gun so it doesn’t hit the ceiling before it reached its maximum height.

Another group decided on the easier (and safer) option of using the GLX and motion sensor to capture the horizontal acceleration of the dart when launched off of the table to model a Type 1 Projectile Motion problem. This method reduced a lot of uncertainty in their calculations since the sensors could accurately capture their data and they had the added benefit of not needing to precariously stand on a chair and guess-timate the maximum height. They also managed to finish a lot earlier and have more experimental runs than we did.

Although the sensors did end up making the experiment a lot easier for them, both of our groups were able to make connections between units and truly use the scientific method which made the experiment so much more interesting than our usual structured inquiry labs.

How You Can Support Inquiry Learning in Your Classroom

From these studies it is clear that inquiry-based learning and technology in STEM classrooms have short-term benefits such as increasing student interest and confidence. In addition, these two approaches to learning are complimentary to each other. The ease of use from technology decreases wait times and allows students to move at their own pace. Because students can move at their own pace, they are able to ask questions about the experiment itself. Students are able to benefit from making mistakes in this environment because the data logging software allows them to analyze what they did incorrect and why it is happening.

Through this approach, students are able to be curious in a controlled environment whilst developing essential scientific inquiry skills. There is also more time for meaningful discussion during class through using probeware since it reduces the amount of set up and lessons on how to use the equipment. Because of this, students are less likely to get frustrated or bored from experiments and helps students understand or reinforce their knowledge in the subject. This could improve the number of students pursuing a science education since students are less likely to leave if they are interested and confident in what they are learning.

PASCO and AYVA have a significant amount of resources that further demonstrates the positive impact that probeware technology has in science education such as White Papers on how PASCO supports scientific inquiry. AYVA also provides Curriculum Correlations for Canadian provinces which provides suggestions on how to incorporate PASCO technology into science classrooms across Canada.


References

Hemraj-Benny, T., & Beckford, I. (2014). Cooperative and Inquiry-Based Learning Utilizing Art-Related Topics: Teaching Chemistry to Community College Nonscience Majors. Journal of Chemical Education, 91, p. 1618-1622

Priest, S.J., Pyke, S.M., & Williamson, N.M. (2014). Student Perceptions of Chemistry Experiments with Different Technological Interfaces: A Comparative Study. Journal of Chemical Education, 91, p.1787-1795.

Tanahoung, C., Chitaree, R., Soankwan, C., Sharma, M.D., & Johnston, I.D., (2009). The effect of Interactive Lecture Demonstrations on students’ understanding of heat and temperature: a study from Thailand. Research in Science & Technological Education, 27(1), p. 61-74.

Vannatta, M.W., Richards-Babb, M., & Solomon, S.D. (2010). Personal Multifunctional Chemical Analysis Systems for Undergraduate Chemistry Laboratory Curricula. Joural of Chemical Education, 87(8), p. 770-772.

Save & Share Cart
Your Shopping Cart will be saved and you'll be given a link. You, or anyone with the link, can use it to retrieve your Cart at any time.
Back Save & Share Cart
Your Shopping Cart will be saved with Product pictures and information, and Cart Totals. Then send it to yourself, or a friend, with a link to retrieve it at any time.
Your cart email sent successfully :)