English Français

1-877-967-2726

Glow Stick Kinetics

Glow Stick Kinetics

Want to illuminate the concepts of kinetics? Try Glow Sticks! Glow sticks are a very popular accessory around Halloween because they are cheap, portable and they give off a ghostly glow. But do students understand the chemistry behind the plastic tube that gives them light?

The “glow” from a glow stick is the result of a process called chemiluminescence – a chemical reaction that provides the energy to emit light. A glow stick is housing for two separate chemical solutions. The outer plastic chamber contains a mixture of a phenyl oxalate ester and a fluorescent dye. The inner glass vial contains hydrogen peroxide. When the glow stick is bent, the glass vial breaks releasing the hydrogen peroxide and activating the reaction.

Students familiar with glow sticks will remember that the light fades over time. This fading provides a perfect backdrop for introducing students to kinetics.

Initial Investigation

To study the glow stick fading, you can use a Light Level Sensor. Create a reaction vessel using a Calorimeter Cup and some black electrical tape.

Calorimeter Cup, Glow Stick, Electrical Tabe and Light Level Sensor

Tape the Calorimeter Cup to ensure a dark baseline. Leave a hole in the top for the Light Level Sensor.

Light Level Sensor over Reaction Vessel

Create a graph of Light Level vs. Time using SPARKvue® software. Remove the reactants from the plastic casing to eliminate interference with the Light Level Sensor.

CAUTION: The reactants are non-toxic and non-flammable, but contact with skin or eyes may cause discomfort. In case of contact, rinse with water. Reactants can also permanently stain clothing or furniture. Use appropriate precautions.

Carefully cut a hole in the top of the glow stick and pour the phenyl oxalate ester and fluorescent dye mixture into a small beaker. Then break the glass vial and pour the hydrogen peroxide into the small beaker.

Glow Stick reaction

Cover the reaction vessel with the lid and the Light Level Sensor, and start data collection.

Room Temp Glow stick light level
The light intensity is decreased to half its original value after about 5 minutes.

Exploration

Now that it is established that the reaction can be studied with the Light Level Sensor, you can ask your students to explore factors that would affect the reaction. Some possible ideas for exploration could include:

  • Can you make the reaction brighter?
  • How does temperature affect the reaction?
  • Does the concentration, or amount of reactants affect the reaction?

For example you could have the students look at temperature. Create a hot water bath. Cut the top off of the glow stick and heat it up in the hot water bath.

Hot water bath

Once the hot water bath with the glow stick has reached a sufficient temperature (about 600C), pour some of the hot water into the Calorimeter Cup. Add a Fast Response Temperature Probe to the water in the Calorimeter Cup. Build a page with a graph of Light Level vs. Time and digits display of Temperature. Prepare the glow stick components as before and start data collection.

Glow Stick - high temperature reaction
The initial light level is much higher than the room temperature glow stick, and the reaction happens at a much faster rate.

Using the Light Level Sensor, a Calorimeter and a glow stick provides a unique way to to explore kinetics with materials that are both familiar and fun!

Related Products:

Leaf Absorption Spectra

Leaf Absorption Spectra

Fall is the perfect time of year for you and your students to investigate plant pigments. If the curriculum sequence doesn’t fit, you can always squirrel away some data for later! PASCO’s Wireless Spectrometer (and its free Spectrometry software) makes it quick and painless to do data collection and get full spectrum scans. No more warm-up time, tedious wavelength adjustments, or students waiting in line!

Download Free Lab Activity

Analyzing the absorption spectra is a popular lab activity that uses simple materials and can easily be extended into a student inquiry. PASCO’s biology team developed this new experiment to complement existing manuals and is available free to download.

Sample data showing the absorption spectra from several tree species (Tree of Heaven, Big Leaf Maple, and Black Oak leaves).

Enzyme Data-palooza

Enzyme Data-palooza

Many biology courses at every level start the year studying enzymes since they are integral to so many biological processes. No matter what your preferred enzyme and substrate, sensors can help you get more data, and better data, faster. As you can see, we like to catalyze with catalase since it’s widely available (in nearly all living things) and easy to process for lab use. For example, using the Wireless Pressure Sensor with a simple yeast suspension and 3% H2O2, students can begin collecting data for under $100/station – and look at how much data can be produced!

Figure 1. Each setup uses a 15 mm test tube, #1 1-hole stopper, 3 mL of 3% H2O2, and 1 mL of yeast suspension in a water bath at a set temperature.
Figure 2. SPARKvue monitors bath temperature while recording pressure data for each reaction.

Table 1. Rate of Reaction for Yeast and Hydrogen Peroxide

Condition Trial 1
kPa/min)
Trial 2
(kPa/min)
Trial 3
(kPa/min)
Average
(kPa/min)
3°C 0.280 0.155 0.733 0.389
15°C 0.547 0.633 0.589 0.590
25°C 0.981 1.015 1.134 1.043
35°C 1.591 1.732 1.643 1.655
45°C 1.045 0.941 0.899 0.962
Figure 3. Graph of Reaction Rate vs Temperature.

With more data, it’s possible to produce meaningful descriptive statistics with your students. This supports students’ math literacy and is useful to identify runs/groups that are outliers from the class data. While these outliers are often procedural errors, they can provide a useful springboard to inquiry. Ask students to determine why the group’s results differ. Are their results reproducible? If time allows, they can explore additional variables that can add to their understanding of protein structure, enzyme reactions, and even evolution.

The data above was produced using the Wireless Pressure Sensor. The protocol is the same for the Oxygen Gas Sensor; download the lab for your preferred approach.

Related Products:

Ocean Acidification

Ocean acidification is a byproduct of increasing atmospheric CO2 levels around the globe, which is also causing climate changes. This global phenomenon can be difficult conceptually for students, but it is easy to model using sensors.

Here’s a quick video using the Wireless CO2 and Wireless pH sensors:

Using a few simple materials, this quickly demonstrates to students what impact gaseous CO2 can have on the pH of water as it dissolves. Ask students to consider the limitations of this model: How does it differ from earth systems? How could the model be improved?

Looking to extend this into a student lab? We’ve got an inquiry lab where students can act as the CO2 sources and monitor pH with a sensor, while learning more about the chemistry behind ocean acidification.

Free Downloads:

Here are a handout and PowerPoint presentation that have been used when performing this activity as part of a PASCO workshop.


Enzyme Activity in AP Biology

Enzyme Activity in AP Biology

Catalyze student learning in AP*® Biology through an investigation of enzyme activity. By using a PASCO Wireless Spectrometer students can monitor the reaction in real-time and build a more robust data set.

Students can investigate the decomposition of hydrogen peroxide into water and oxygen by using peroxidase (found in filtered turnip extract). With a small amount of Guaiacol in solution the reaction can be easily monitored in the Wireless Spectrometer because it changes color as it oxidizes.

After creating a blank and calibrating the Wireless Spectrometer on the Analyze Solution tab, select the target analysis wavelength of 470nm.

Figure 1. Setting the analysis wavelength in the Spectrometer Software.

Students can then go to the Time tab to monitor the reaction at 470nm. Prepare the reaction in a standard cuvette by adding the substrate (H2O2), pH buffer, and Guaiacol. Once the enzyme extract is added the reaction proceeds quickly, so make sure to test the reaction before the lab and dilute the enzyme extract if needed.

Figure 2. Monitor the reaction in real time before analyzing and comparing runs from various trial groups.

After establishing a baseline, the rest is inquiry! By changing the pH buffer, temperature, or enzyme and substrate concentrations students can quickly explore the reaction and identify the optimal conditions for turnip peroxidase. Data can be analyzed in the software to determine the rate of reaction or exported for aggregation and further analysis. This is a great lab to introduce or reinforce concepts around protein structure and specific nature of the enzyme-substrate complex. Students can also compare the catalyzed and uncatalyzed reaction to see how the energy of activation is lowered by these (seemingly magic) biological molecules!

Download a Free Copy of the Lab Handout

Figure 3. Sample data from investigation of Peroxidase reaction at pH 2, 4, 7, 10, 12.

* AP is a registered trademark of the College Board, which was not involved in the production of, and does not endorse, this product or activity.


Related Product:


Untangle Your Circuits!

Making the leap from circuit diagrams to functioning circuits has never been so clear or intuitive. Circuits can be easily built and tested enticing students to more thoroughly explore the behavior of electricity. Your students will no longer be frustrated trying to trace out the electrical pathway through a nest of wires.

Supports inquiry learning – circuits can be easily modified and be quickly swapped out and rearranged

Compatible with both traditional and computer based labs – works with PASCO’s sensors as well as traditional Volt and Ammeters

Classroom management is a breeze – Storage is made simple with the included
Grattenels case and nesting trays

  • The 8 cm by 8 cm modules ensure that all students in a group can clearly see the completed circuit
  • Physical Components (resistors, batteries, switches, etc.) with identifying electronic symbols are visible on the surface of the modules
  • At a glance errors in a circuit can be quickly found without checking each connection

The Basic Kit includes enough modules to do 5 basic experiments:
  • Ohm’s Law
  • Series/Parallel Circuits
  • Batteries & Bulbs Circuits
  • Switches/Open/Closed Circuits
  • Electric Power & Energy

The Advanced Kit includes the Wireless Current & Voltage Sensors and modules for 7 additional experiments:
  • Kirchoff’s Laws
  • Electromagnets
  • Electromagnetic Induction
  • RC & RL circuits
  • Variable Resistance
  • LED Circuits
  • Electric Motors

Rhonda & Craig Invade LA – NSTA 2017 Recap

We were thrilled to attend this year’s NSTA national conference in Los Angeles.

Our first destination was the exhibit hall where PASCO had a very lively booth with several interactive displays.  By far the biggest hit  was the ‘Match Graph’ challenge with a super-sized Smart Cart.  Who knew that learning could be this much fun!  Check out the video to see my less than stellar attempt.

PASCO’s booth was fun, however, the real action was in the teacher facilitated workshops.  In total PASCO had 20 unique hands-on sessions that were over flowing with enthusiastic teachers.  Time didn’t allow us to see all the sessions, but we did manage to squeeze our way into a very energetic session on the new Modular Circuit Kits.  Teachers had a great time ignoring instructions and spent most of the session designing their own unique circuits – obviously investigative learning is not just for students.

We were also fortunate enough to get a seat at PASCO’s workshop session on climate change.  The session featured several hands-on modeling activities, including an investigation where teachers used the Wireless pH sensor to monitor the mitigating effects of natural buffers on acid rain.  The biggest hit of the session was seeing PASCO’s new Wireless Carbon Dioxide sensor in action.  Teachers were excited to discover that a reliable, practical and affordable way to measure CO2 has finally arrived.

Over the next week we’ll share some more videos on our adventures at the conference.

Test the Rainbow! Understanding pH

Students often struggle understanding pH. While we can tell them that it is a logarithmic function, students are more likely to associate “logs” with a calculator button or a piece of wood. So how do we get them to understand what the pH scale really means? Look for a lesson, instead of a pot of gold, at the end of a rainbow.

Let’s start with the acids. First have the students pour 10 mL of 0.1 M HCl into a test tube. Using graduated cylinders and pipets they can add 1 mL of that solution to another test tube with 9 mL of water making a 0.1 M solution. They should repeat the process of taking 1 mL of the previous solution and adding 9 mL of water until there are 5 solutions. They won’t know it, but they just performed a serial dilution. Now they can add some universal indictor to the solutions for a splash of colour.

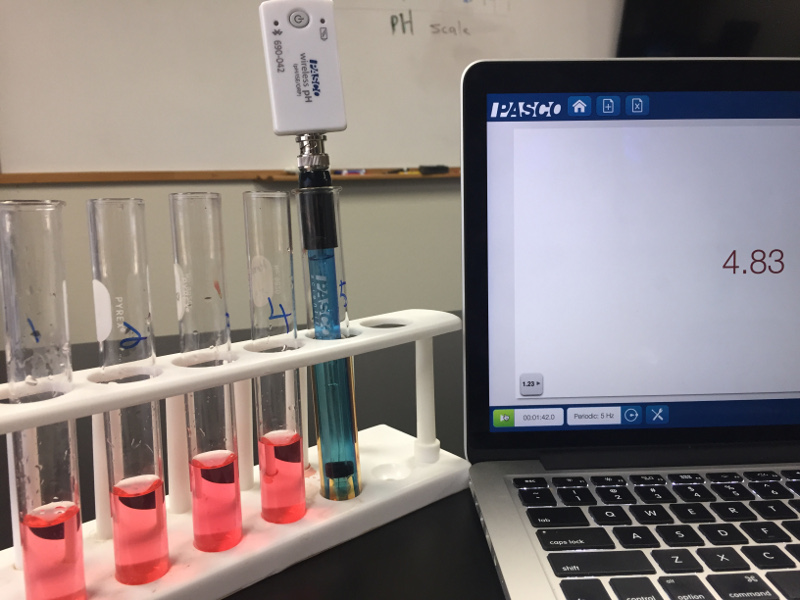
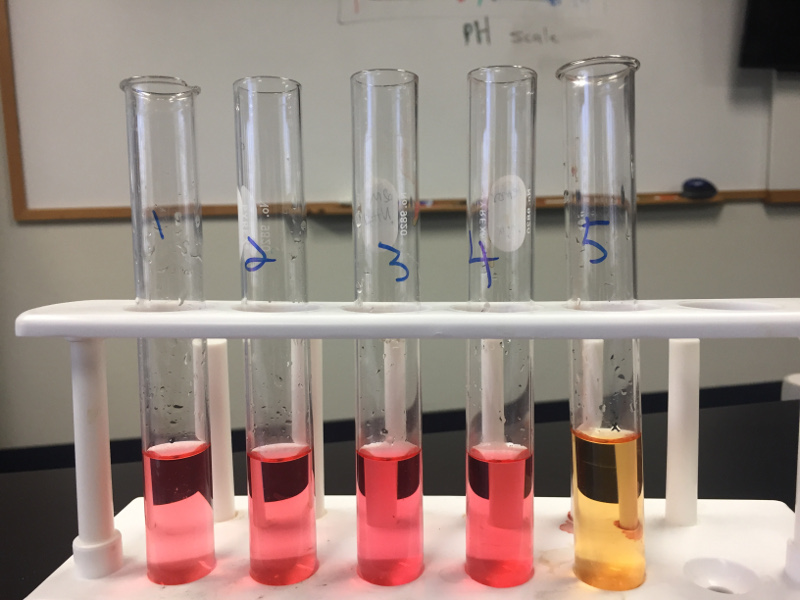
Indicators are nice, but they really are just an indicator. In this case the indictor was not able to distinguish between the first four test tubes. (Note to self: get some new universal indicator!). Since the true colors aren’t shining through, it’s important to remember that to really understand pH, your students need to take actual pH measurements.

Now comes the pHun part! After recording the data for the solutions, it is important for students to try to make some meaning out of those measurements. Time to dust off those concentration calculation skills. They should be able to calculate the concentration, and write the concentration of the acids in scientific notation.

No need to travel somewhere over the rainbow, all your students need now are some good guiding questions and they should see that pH is primarily based on the negative exponent of the concentration of H+.  With this understanding, pH=-log[H+] can be something more powerful than just a formula to plug and chug in calculator.


You can even extend this activity to pOH and its relationship to pH if you drop the base. Following the same procedure, students can perform a serial dilution starting with a 0.1 M NaOH solution.


After this colourful and engaging activity with the Wireless pH sensor and some fresh universal indicator, your students will be able to find the rainbow connection:  a better understanding of the pH scale, what it means and how it’s measured.

Introducing PASCO’s New Wireless CO2 Sensor

The ability to easily and affordably measure CO2 levels is great news for Biology and Environmental Science teachers.

PASCO’s new Wireless CO2 Sensor communicates directly with a wide range of Bluetooth equipped computers without requiring an expensive interface.

Ambient environmental Carbon Dioxide levels are typically very low. This means any experimental changes to CO2 levels tend to be significant in percentage terms providing convincing and reliable evidence of the phenomenon being studied.

Investigations based on the wireless CO2 sensors are easy to setup and they work.

Other opportunities for CO2 investigations include:

  • Cell Respiration
  • Photosynthesis
  • Metabolism of cold blooded animals
  • Enzyme activity
  • Fermentation
  • Indoor & Outdoor CO2 levels
  • Pollution
  • Decomposition


Save & Share Cart
Your Shopping Cart will be saved and you'll be given a link. You, or anyone with the link, can use it to retrieve your Cart at any time.
Back Save & Share Cart
Your Shopping Cart will be saved with Product pictures and information, and Cart Totals. Then send it to yourself, or a friend, with a link to retrieve it at any time.
Your cart email sent successfully :)