English Français

1-877-967-2726

Lessons Learned from the Great American Eclipse


Eclipses aren’t only awe-inspiring to witness, they’re also an excellent opportunity for science! Find out what scientists (and PASCO!) learned from the 2017 eclipse, and mark your calendar for the upcoming solar eclipses!

What was the Great American Eclipse?

The Great American Eclipse was a total solar eclipse that occurred on August 21, 2017, and was visible across the United States. It was the first total solar eclipse visible from coast to coast in the US in almost a century. The path of totality, where the Moon completely blocked the Sun, passed through 14 states, starting in Oregon and ending in South Carolina. At its maximum point, viewers on Earth could experience the eclipse for around 2 minutes and 40 seconds.

The eclipse generated significant public interest, with millions of people traveling to witness the event and many others tuning in to live broadcasts. It also provided a special opportunity for scientists to study the Sun and its effects on Earth.

A Unique Opportunity for Scientific Discovery

The Great American Eclipse led to several scientific discoveries, many of which were only made possible by the unique conditions an eclipse creates. During a total solar eclipse, the Moon completely blocks the Sun’s light, allowing scientists to gather data about the Sun’s shape, structure, and its relationship with other phenomena, like solar wind. Researchers use a combination of tools to collect eclipse data, including ground-based and airborne instruments, as well as satellites that provide data about the Sun’s corona, magnetic field, and its impact on the Earth’s atmosphere and ionosphere.

What Did Scientists Learn from the 2017 Solar Eclipse?

Some of the most significant observations made during the Great American Eclipse regard the corona, the outermost part of the Sun that’s usually too dim to see.

For years, scientists had been puzzled by the fact that the corona is far hotter than the surface of the Sun. During the Great American Eclipse, researchers were finally able to determine just how hot the corona actually is. By measuring the temperature of the corona more accurately, scientists found that it was about one million degrees Celsius (1.7 million degrees Fahrenheit), which is much hotter than the Sun’s surface temperature of around 5,500 degrees Celsius (10,000 degrees Fahrenheit).

But that wasn’t all scientists observed. Researchers also studied the magnetic field of the corona and found it to be much more complex than previously thought. Just like Earth, the Sun has a magnetic field with north and south poles. They also discovered evidence of “coronal loops,” which are giant arcs of plasma that are trapped in the corona’s magnetic field.

The Great American Eclipse provided a rare opportunity for scientists to study the Sun’s corona in ways that are not possible under ordinary conditions. The next opportunity for such studies isn’t until October 14, 2023, when the Great North American Eclipse crosses our skies.

Weather Changes During the Great American Eclipse

Because the Moon’s shadow cools Earth during a solar eclipse, several atmospheric changes occur following the drop in temperature. The 2017 total solar eclipse produced some noticeable weather effects in areas located in the path of totality, particularly in the moments leading up to and during the period of totality.

While the amount of cooling varied depending on the location and the weather conditions at the time, some areas experienced a temperature drop of 6.6ºC! In addition to the reduced temperature, the Great American Eclipse also affected wind patterns. As the air temperature cooled, the density of the air changed, which in turn affected the way that air flowed around the area. This created a brief period of stillness and calm in some areas, as the usual winds died down.


Tracking Eclipse Weather Changes With PASCO Wireless Sensors

At PASCO, we made some observations of our own during the Great American Eclipse! Here in Northern California, we only experienced a partial eclipse, but the weather changes did not disappoint! Using a Wireless Weather Sensor with GPS, we measured and compared the relationship between Temperature (ºC) and Light Intensity (lux) over the duration of the eclipse. Check out our results below!

As the Moon covered the Sun, there was a sudden drop in light intensity, which was shortly followed by a reduction in temperature. Though we only experienced a partial eclipse, we still observed a drop in temperature of 2.37ºC!

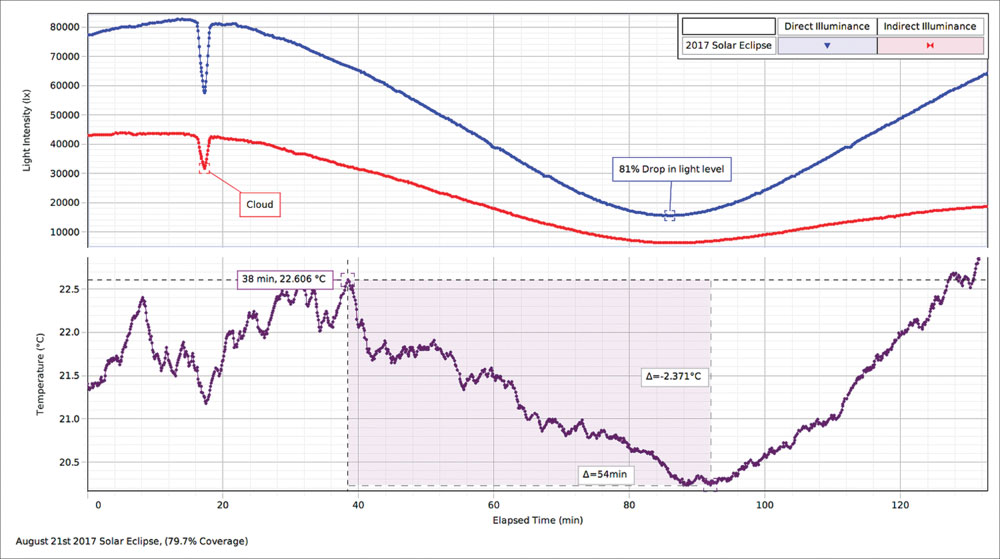
Looking for ways to study the next eclipse with your students? Head over to our eclipse page to learn how to conduct this experiment for yourself!

Eclipses and Animal Behavior

A solar eclipse catches the attention of people for its beauty and awe, but we might not be the only ones who notice. Many animals also recognize a change in their environment. As the sky darkens and the temperature drops, some species behave peculiarly.

Keeping Your Pet Safe

Worried that your pet will get scared during the eclipse?

It is unlikely that dogs and cats will react to solar eclipses, as they typically do not have a strong biological or behavioral response to changes in light or natural phenomena like eclipses.

However, it is possible that some dogs or cats may become confused or disoriented by the sudden change in light, especially if they are outside during the eclipse. Also, excited crowds can cause anxiety for some pets, so be careful about bringing your furry friend along if you decide to view the solar eclipse from a public place.

To ensure your pet’s safety and comfort during an eclipse, it is generally best to keep them indoors or in a calm, secure environment. You may also want to consider providing your pet with distractions such as toys or treats to keep them occupied and help them feel at ease.

Visit our eclipse page for information on when and where to view upcoming solar eclipses!

Wildlife Reactions to a Solar Eclipse

Wild animals tend to have more overt responses to eclipses than our domestic companions. Some animals may become disoriented or confused by the sudden change in light, while others may simply adjust their activities to the altered conditions.


For example, some birds may stop singing during an eclipse, return to their nests, or stop flying. Researchers reason this is likely because they perceive the darkness as a signal that it is time to roost for the night. Animals that usually start stirring at sunset like frogs and crickets may start to chirp. Some spiders may take down their webs, only to rebuild them again when the sunlight returns. Nocturnal animals such as bats and owls may become active during the eclipse, while diurnal animals such as squirrels and deer might be more active just before and after the eclipse.


In some cases, animals may exhibit unusual or even erratic behavior during an eclipse. For example, researchers have observed ants and bees behaving as if it is nighttime during a total solar eclipse, even though it is still light enough to see. One study during the 1984 eclipse watched as chimpanzees at the Yerkes Regional Primate Research Center climbed up their enclosure as high as they could and turned to face the sky.

In a study conducted during the 2017 eclipse at the Riverbanks Zoo in South Carolina, researchers found that 76% of the animals they observed exhibited a behavioral change in response to the total eclipse. Most of these behaviors were typical of the animal’s evening routine.


Some of the behaviors, however, indicated some level of anxiety for the animal. For instance, a head male gorilla charged his glass enclosure, and one male giraffe proceeded to sway his entire body, including his neck, back and forth. Strangely, all the baboons ran around their pen together as totality approached, despite having just been in two separate groups. Once totality passed, they stopped running and returned to their previous arrangement. Flamingos also behaved out of character, huddling together on an island in the center of their enclosure and remaining still. As totality waned, the flock dispersed to their usual groups.

The response of animals to solar eclipses is complex and varies depending on a variety of factors, including the species, their natural behaviors, and the specifics of the eclipse itself. So, while enjoying the wonder of a solar eclipse, take note of any animals around you–you might spot some interesting behaviors!

Want to measure light and temperature during an upcoming eclipse for yourself? Check out our collection of free eclipse activities, or learn how to build your own pinhole projector with our DIY Eclipse Handbook.

Order PASCO Eclipse Glasses HERE!

History of Solar Eclipses

Solar eclipses have fascinated humans for thousands of years, and many ancient cultures have developed their own myths and legends to explain these rare astronomical events.


Early Explanations

One of the earliest known records of a solar eclipse comes from the ancient Chinese, who recorded an eclipse in 2136 BCE. They believed that a dragon was devouring the Sun, and civilians would make loud noises and bang on pots and pans to scare it away.

In ancient Greece, the philosopher Anaxagoras correctly predicted a solar eclipse in 478 BCE. He was the first to suggest that the Moon shines by reflecting light from the Sun, and he was imprisoned for this proposal. His research led to his discovery that eclipses are caused by the Moon blocking the Sun’s light when it passes in front of it. However, his scientific explanation for the phenomenon was not widely accepted until centuries later.

Another Greek philosopher, Aristotle, later refined this theory, explaining that the Earth was at the center of the universe and that the Moon’s orbit was slightly tilted relative to the Earth’s orbit around the Sun. This meant that eclipses occurred when the Moon passed directly between the Sun and Earth, casting a shadow on the planet.

The ancient Maya of Central America were also skilled astronomers and recorded solar eclipses in their calendars. They believed that the eclipses were a sign of impending doom, so they would perform elaborate rituals to appease the gods.

In the Middle Ages, Islamic astronomers developed more accurate models of the movements of the Sun, Moon, and planets. The Persian astronomer Al-Battani, for example, refined the earlier Greek models, proposing that the Moon’s orbit around the Earth was elliptical rather than circular.

By the time of the Renaissance, scientists had developed even more sophisticated theories to explain eclipses, incorporating ideas such as the rotation of the Earth and the elliptical orbits of the planets.

Today, astronomers have a detailed understanding of the mechanics of eclipses, and are able to predict the exact timing and location of these rare astronomical events with great precision. Solar eclipses are still a source of wonder and fascination, and astronomers and scientists continue to study them to gain a better understanding of our universe.


Famous Eclipses

Eclipses that make it to the status of “famous” are generally those that have led to scientific discovery. Some, though, were noted for the sheer number of people who witnessed them.

One of the first recorded eclipses was the Thales of Miletus Eclipse in 585 BCE. The ancient Greek philosopher Thales of Miletus correctly predicted the solar eclipse would occur during a battle between the Lydians and the Medes; however, historians debate the exact year the eclipse occurred, and Thales’ method to predict the event remains uncertain. Regardless, upon observing the phenomenon in the sky, soldiers on both sides laid down their weapons and called a truce to end the war.

In 1715, the famous astronomer Edmund Halley (of Halley’s comet) correctly calculated the event of a solar eclipse within four minutes over England. Halley used Isaac Newton’s newfound theory on gravitation for his prediction, and he’s credited with funding the publication of Newton’s work in the Principia.

The Total Solar Eclipse of 1919 is famous for providing the first experimental evidence for Einstein’s theory of general relativity; Einstein predicted that some stars would appear in a different position in the sky during the eclipse due to the Sun’s gravity bending the starlight. Astronomers observed this shift in position to be accurate, and Einstein published his complete theory soon after.

The Solar Eclipse of August 11, 1999 was the first visible total solar eclipse in the United Kingdom since 1927, and the first visible in Europe in nearly ten years. It was one of the most photographed eclipses in history, viewable to over 350 million people.

The Great American Eclipse of 2017 was a total solar eclipse that was visible–at least partially–across the entire United States. Millions of people watched, as it was the first total solar eclipse to span the United States since 1918.

Solar Eclipse Activities & Resources

Want to conduct your own experiments during this year’s solar eclipse? Give your students the science experience of a lifetime with these free solar eclipse activities. These free activities can be performed with students of all ages and include step-by-step instructions, analysis questions, and preformatted software files for students.

Light and Temp Study

Solar Eclipse Light and Temperature Study

In this lab, students become junior eclipse scientists as they use Wireless Light and Temperature Sensors to track how light and temperature change during a solar eclipse.

Weather Study

Weird Weather: Solar Eclipse Weather Study

Strange things happen during a solar eclipse! This lab lets students uncover local changes in weather conditions using a Wireless Weather Sensor with GPS.

UV Light Study

Why Do We Wear Eclipse Glasses? A Study with UV Beads

In this sensor-free activity, students use UV beads to compare the effectiveness of sunglasses and eclipse glasses in blocking UV light.

Protect Your Eyes with PASCO Eclipse Glasses!

PASCO Glasses

Safety is essential when witnessing any solar eclipse.
Ensure your students are protected with our certified eclipse glasses!

Simple DIY Pinhole Projector

Looking for ways to safely view the upcoming solar eclipse? Why not build your own pinhole projector? With just a few household supplies and some simple instructions, these DIY eclipse projects provide a great way for students to engage in eclipse science. Check out the DIY guide below, and visit PASCO’s eclipse page to learn more about the upcoming eclipses!

Materials:

  • Two large white cards (cardstock, poster board, or even paper plates will do!)
  • Pushpin (or something to poke a small hole through the paper)
  • Sunshine!


Directions:

  1. Using the pushpin, poke a small hole in the center of one of the cards. Make sure the hole is circular.
  2. Facing away from the sun, hold the card up near your shoulder so sunlight can pass through the pinhole.
    Hold or mount the second card closer to the ground so it’s aligned with the punctured card. You should be able to see a small circle of light projected onto the second card.

This is an inverted image of the Sun! During a solar eclipse, the shape of light on the card will be crescent-shaped as the moon passes in front of the Sun.

Pinhole Projector Box

Materials:

  • Cardboard box (a shoebox or larger is a good size)
  • White piece of printer paper
  • Duct tape
  • Box cutter
  • Aluminum foil (3”x3” square)
  • Pushpin (or something to poke a small hole through the paper)
  • Sunshine!

Directions:

  1. Using the box cutters, cut out a square in the center of one of the sides of your cardboard box. If you have a rectangular box like a shoebox, cut out the square on one of the shorter sides. The square should be about 2”x2” in size.
  2. Tape the printer paper inside of the box on the opposite side from the square cutout. (You should be able to look through the cutout and see the paper.) The paper will act as the “screen.”
  3. Tape the aluminum foil completely over the square cutout.
  4. Use the pushpin to puncture a small hole in the center of the aluminum foil.
  5. Cut out a large hole in the bottom of the box. This will be the peek-hole where you look into the box to view the projection. If you have a large box, you can cut the hole large enough to fit your head through. Try to limit excess light from entering the box so the projection of light through the pinhole isn’t obstructed.

Now it’s time to test your projector! Find a sunny spot outside and hold your box up to the sun so light can enter the pinhole. When you look through the peek-hole, you should see a circle of light on the paper. This is a projection of the Sun! The longer your box is, the larger the projection will appear on the paper. During a solar eclipse, the projection will resemble a crescent as the moon passes in front of the Sun.

Why does the image through a pinhole appear inverted?

Viewing an eclipse through a pinhole projector creates an upside-down image due to a phenomenon known as the camera obscura effect. A pinhole projector works by allowing light from the Sun to pass through a small hole and project an inverted image of the Sun on a surface, such as a piece of paper, located opposite to the hole.

The camera obscura effect occurs because light travels in straight lines and the pinhole only allows a small amount of light to pass through it. As a result, the rays of light that pass through the top of the pinhole will be projected on the bottom of the screen and vice versa, causing the image to be inverted. This is the same principle that applies to the images formed by a camera lens or our eyes, which also produce inverted images on our retina before our brain processes them and flips them right-side up.

Eclipse Safety

It is never safe to look directly at the Sun. Looking directly at the Sun during a solar eclipse–or ever–is very dangerous, and can cause permanent eye damage or blindness. To protect your vision, specialized solar viewing glasses or indirect viewing methods should always be used to observe a solar eclipse.

If you plan to view a solar eclipse using specialized glasses, be sure to check that they’re legitimate. Solar eclipse glasses should be thoroughly inspected and meet specific safety requirements for certification.

Protect Your Eyes with PASCO Eclipse Glasses!

PASCO Glasses

Safety is essential when witnessing any solar eclipse.
Ensure your students are protected with our certified eclipse glasses!


PASCO Wins Best of STEM for 2023 Educators Pick Awards

We are excited to share that three PASCO products have been chosen as Best of STEM Winners!

Educators Pick Best of STEM is a program designed to rank and award outstanding innovations in STEM education with educators as the judges. Winners are chosen through an aggregate vote based on the criteria for the product category.

This year, PASCO submitted three entries which all won their category! Read about each of them below, and also check out the press release by GlobeNewswire here featuring PASCO Academy and our Meter Stick Optics Complete System: Science Educators Name PASCO Scientific as Best of STEM in Two Categories.

PASCO Academy | Best of STEM: Video-Based Learning

PASCO Academy is a comprehensive library of digital hands-on resources for students both inside and outside the classroom. There are three versions: Physics Academy, Chemistry Academy, and Biology Academy.

PASCO Academy is designed to do some of the heavy lifting for science educators by providing digital curriculum, including activities and resources, that integrates with existing classroom lessons. With PASCO Academy, educators have access to a plethora of distance learning curriculum, virtual labs, data sets, and on-demand PD, enabling them to pick and choose which resources to utilize.

PASCO Academy supports student learning by having them not only study science, but also do science: Students gather their own data, conduct data analysis, and use downloadable resources like instructional videos to develop and support their conclusions. They can even share their collected data to multiple devices (or stream it live!) to collaborate with their peers, as scientists do.

The PASCO Academy provides distance learning video segments, including a weekly overview video, a virtual lab investigation with corresponding student activities, and a follow-up video that ties the week’s learning objectives together. Registered educators have access to the Academy Portal, where they can access a library of distance learning videos, student labs, sample data files, links to relevant information within the included Essential curriculum, and more.

E-learning, hybrid classes, student and teacher absences, and short class times can limit the amount of quality hands-on learning that science students are exposed to. PASCO Academy is comprehensive enough that you can have your substitute teacher run the lab, keeping your class schedule on track when you can’t be there.


Meter Stick Optics Complete System | Best of STEM: Physics


PASCO’s Meter Stick Optics Complete System encourages student observation, measurement, and analysis of optics, all in a compact and simple system.

Component holders easily attach to the meter stick and include an indicator window so students can accurately measure their position. Lenses are built into cases with holding tabs to prevent fingerprints and add durability when students interchange them between holders. The system includes a bright, rechargeable light source that can easily be seen in a lit classroom, and the viewing screens are designed so the projected image is bright and clear.

The system’s compact and durable design allows students to quickly and accurately maneuver components, making multiple investigations possible in the span of one class period.


Coding with Vehicle Sensor Technologies Kit | Trailblazer Award: Cross-Curricular Coding

The //code.Node is a revolutionary device that uses Blockly, sensors, and feedback to teach students coding skills and data literacy. The pocket-size coding solution includes encodable sensors for light, motion, sound, and magnetic fields, as well as a speaker, RGB light, and 5×5 LED array. Using PASCO software and the //code.Node, students can create custom experiments that range from simple data collection to advanced, measurement-based sensory feedback. As they execute their code, students collect real-time data and visual feedback that helps them improve with each activity.

The Coding with Vehicle Sensor Technologies Kit is geared towards new coders with a simple wireless design that uses block-based coding, allowing students to focus on the basics of programming without worrying about syntax. The //code.Node Cart has a spinning magnet on its wheels that the attachable //code.Node detects, allowing students to determine the cart’s distance and velocity. Five thorough investigations are included in the kit, featuring video lessons and student worksheets, all accessible through a convenient digital flipbook.

The //code.Node lets students go beyond computer animations to controlling output devices like speakers and LED lights, and the included activities integrate live data collection and analysis so students are challenged to observe, question, and retest their theories.

STEM Education Inspires Teen to Solve the Food Transport Issue

On April 20th, 2023, yahoo!finance shared an inspiring story about a High School Junior from Illinois coming up with a solution to bring more produce to the grocery store shelves. Through her utilization of sensors, the teen tracked the ethylene measurements of the crop’s output and adjusted temperature and humidity levels to lengthen the crop’s lifespan. This revolutionizing idea significantly reduces the loss of crops from transportation, solving one of the world’s toughest problems.

To read more about this story, please visit ‘Solving the World’s Tough Problems Through STEM’.


Our Take…

What started as an inspiration from the teen’s STEM classes became the very first step in her journey to changing the world. The school provided the teen the necessary resources and support to embark upon her project. Hence, it is with great promise that with the right tools and motivation, any student from any school can become inspired, begin their own project, and then become the world’s inspiration.

This article made us think of PASCO’s Wireless CO2 Sensor, Temperature Sensor, and Weather Sensor and how these tools can be used beyond the classroom through solving the world’s toughest problems in agriculture and sustainability.

It is more than just learning a subject, it is the key that will spark innovation and creativity in more young minds. 

Growing Tomatoes With the Greenhouse Sense & Control Kit

Over the last couple of months, AYVA Educational Solutions has been growing tomato plants from the Let’s Talk Science Tomatosphere project. In this project, you are given two unknown packets of seeds, labeled T and U. One packet of seeds have been to space, while the other has not. The purpose of this experiment is to germinate and grow the tomato plants from both packets, tracking their growth, and hypothesizing which plants are the space seeds! You can guess which ones you think are the space seeds in the survey at the bottom of this post! Submit your hypothesis and you will automatically be entered into a raffle to win a free PASCO Wireless Temperature Sensor! If you would like to find out which seeds have been to space we encourage you to participate in this fantastic program!! Sign up for your own packet of seeds here.

We used PASCO’s ST-2997 Greenhouse Sense and Control Kit to monitor and regulate conditions for optimal growth! By researching the optimal growing conditions for a tomato plant, we adjusted the levels of the greenhouse system to meet those needs.

Using Blockly, we block coded the Greenhouse conditions we desired, programming a 24 hour sunlight and watering cycle, and ensuring the temperature stayed at 23 degrees Celsius at all times. Once the code was exported into the //control.Node, we planted 3 seeds from each packet on the appropriate sides (T or U).

We tracked the growth of our plants from January 20th to March 31st, as they developed, they went from seeds to leafy plants.

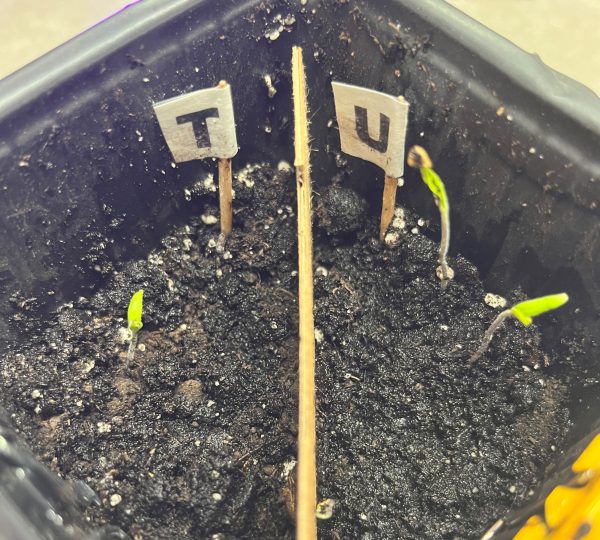
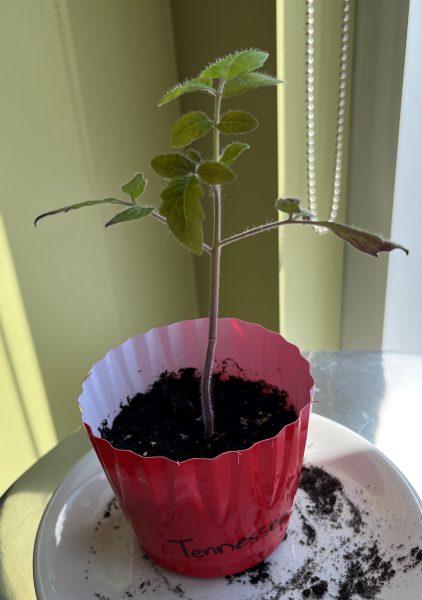
After just one week of being inside the Greenhouse, three out of six seeds germinated and sprouted! As a couple more weeks went by, two more seeds sprouted. Unfortunately, one seed (on the T side) did not germinate. Overall totaling three plants on the U side, two on the T side. At this point, we hypothesized which of the seeds had been to space and which had not, and wrote down our predictions to compare to the results later on. You can share your predictions in the survey at the bottom of this post, and find out which seeds were the space seeds!

In the fourth week of growth we decided to name the plants so that they could be more easily identified, charted, and referred to. On the U side, we named the tomato plants Tennessee, Toby, and Tiny Tim. Then on the T side, we named the plants Thiara and Theodore. Tiny Tim was the smallest plant during the beginning of the growth period, while Tennessee was the largest of the seedlings. Thiara also germinated the latest of any of the seeds, excluding the one seed that never sprouted. She quickly caught up to the others though, and in the 4th week she was the 3rd tallest of them.

After 6 weeks of growth, the plants were beginning to falter as they combatted against one another for nutrients and water. To replenish what they lost, we decided to separate the plants. Three of the plants, Tennessee, Tiny Tim and Thiara were moved to their own pots. However, Toby and Theodore remained in the self-regulating greenhouse to continue identical conditions. Within days of separating the plants, they all began to look healthier as they received the nutrients and space that they needed.

Into the ninth week of the experiment, the plants are growing taller and broader. Now that they each have their own space, they are able to thrive. The featured photo on the right shows Tennessee healthy and strong! With no one contesting him for nutrients, he is tall, green and healthy. At this point, they are almost fully mature, and will be entering the flowering stage shortly. This week we decided to reveal the answer to the lingering question we had been wondering for months – which seeds had been to space? Was it Theodore and Thiara (T Side)? Or perhaps did Toby, Tiny Tim and Tennessee (U side) spend some time in space? Find out the answer below!

Shoutout to the PASCO Greenhouse, as this project could not have been as successful without it! The self-regulating greenhouse allowed us to grow the plants healthy and strong -with minimal intervention from us. We were able to germinate 5/6 seeds and maintain the ideal moisture and temperature levels for the plants to grow, even amidst a cold and dark winter with many days out of the office. PASCO’s Greenhouse is the perfect educational kit for your classroom, teaching students several ecological concepts such as photosynthesis, anatomy of plants, and the ways different conditions affect the growth of plants – all with the new focus and importance of coding. You can start the Tomatosphere project yourself, and facilitate it with the Greenhouse Sense and Control Kit as well.

Make sure to answer the survey below to find out which seeds have been to space and for a chance to win a PASCO Wireless Temperature Sensor! We would love to hear what you think, so share your guesses with us, and your reasoning if you have any!


Featured Products:

PASCO ST-2997 Greenhouse Sense and Control Kit

SPARKvue

Wireless Temperature Sensor


Tracking Acceleration During A Hockey Game

Acceleration and velocity are present everywhere in life, from sports to driving, to walking around. With PASCO’s Wireless Acceleration Altimeter, I decided to see what I can learn from the 7 different data points that it records.

As a hockey player for 18 years, I’ve always wondered how quickly I’m moving on the ice, having never seen myself skate or recorded my speed. I assume of course, that I am right up there with Connor McDavid in terms of speed. I expect the sensor to be able to confirm that for me, while also telling me even more information – my acceleration and velocity in the x, y, and z directions.

The first step in my experiment was to put the sensor into remote data logging mode, so that the altimeter is recording data into its internal storage, instead of needing to be connected to a phone or computer.

When setting up the altimeter, I changed the frequency to 5 Hz, (5 data points per second). The altimeter can record up to 200 Hz but has a limited capacity for how much data it can keep in its internal storage. Once I had put the sensor into remote data logging mode, I used the included Velcro straps to attach it to the back of my shin guard and got ready to step onto the ice.

For the first 9 minutes of the data recording, I am putting all of my equipment on, so the velocity and acceleration are relatively low as I stay within the dressing room.  At the 10-minute mark warm-up begins. For these 5 minutes, I’m constantly moving while I’m skating on the ice, so the acceleration is constantly changing and staying at numbers of higher magnitude.

The magnitude of the data is also slightly decreasing during the 5-minute stretch as I slow down and conserve more energy for the game. When comparing the peaks of this stretch to the peaks of acceleration later on, it’s clear that I wasn’t accelerating as much in warm-ups as I would be when I was playing the game.

At the 15-minute mark, the game begins and I’m on the bench for the first shift, but at 18.5 minutes I get on the ice. There are bursts of acceleration as I get up to speed and little sections of coasting until 19 minutes when there’s a stoppage in play and the acceleration goes down and remains relatively constant. When the play resumes my acceleration begins to spike and then fluctuates throughout the natural progression of the game, as I coast at times and race to get the puck at others.

Over the course of the rest of the game, the peaks and valleys of the graph show clearly when I was on the ice accelerating and decelerating, and when I was on the bench, with the little movement just being from sliding across the bench or standing up to cheer on a goal.

In the different peaks in the graph, it can be seen which shifts I accelerated the most, and which I had a bit less energy. On the first shift of the game, my peak acceleration is 32 m/s2, which is high, but not the highest acceleration of the game. On this shift though, there are 60 data points where my acceleration is greater than 15 m/s2.

Because we are recording at 5 Hz, we can take that to mean that there are 12 seconds in which my acceleration is greater than 15 m/s2. This is not all in one 12-second stretch though, it’s spread out throughout the shift in groupings or bursts of acceleration. By comparison, the shift with the next highest amount of data points over 15 m/s2 is my 4th shift, in which there are 50 such points, or approximately 10 seconds. This 2-second difference is evidence to point towards my fatigue, as the number of such data points decreased more as the game went on, with the final full-length shift containing only 34 of these points (6.8 seconds).

The highest acceleration recorded is 34 m/s2, and that is on the 5th shift of the game. It would seem abnormal that my highest acceleration would be on the 5th shift, as I am already more tired at this point. There is context to explain the abnormality though – on the 5th shift we broke out on a 2-on-1 and I had to accelerate as fast as I could to free myself up to receive the pass and score a goal.

Overall it was a very interesting and insightful experience looking into the data surrounding my skating and gameplay. While I don’t think my acceleration is quite up to par with Connor McDavid, I can say I’m satisfied with my results and happy that the data logging had ended by the time I ended up in the penalty box.

With the Acceleration Altimeter, there are so many cool and interesting ways to record and examine data, and I got a fascinating look at just one of the possibilities by taking it with me during my hockey game. Additionally, there are other data points that weren’t useful for my experience, with angular velocity, altitude, and acceleration in the z direction – playing hockey on a flat sheet of ice somewhat limits how much vertical movement can be performed. I’m excited to dig deeper into the data and for other possibilities and opportunities in the future to learn more, using PASCO’s wireless sensors.

Featured Products:

Wireless Accelerometer/Altimeter

SPARKvue

Save & Share Cart
Your Shopping Cart will be saved and you'll be given a link. You, or anyone with the link, can use it to retrieve your Cart at any time.
Back Save & Share Cart
Your Shopping Cart will be saved with Product pictures and information, and Cart Totals. Then send it to yourself, or a friend, with a link to retrieve it at any time.
Your cart email sent successfully :)