Inverse Square Law
Rick Debenedetti from Streetsville Secondary School in Mississauga demonstrates how to use a Smartphone, a Smart Cart and a Wireless Light Sensor to investigate the relationship between light intensity and the distance from a single point source of light.
Materials Used
PAStrack (ME-6960) $172
Wireless Light Sensor (PS-3213) $141
Wireless Smart Cart (ME-1241) $325
Smart Phone with Flashlight App
Assembly
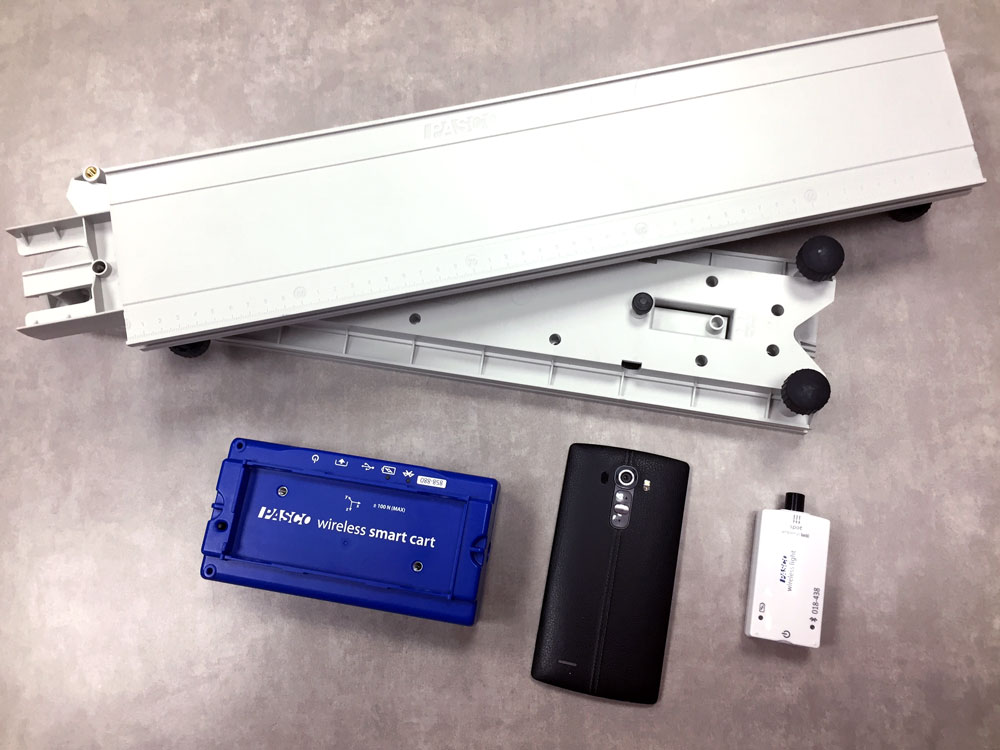
- Place the light sensor on the Smart Cart with the Spot light sensors facing forward (opposite end of the plunger)
- Align the light sensor to the Smartphone’s flashlight as shown in the picture. To get the proper height raise the track using the adjustable legs of the PASTrack.
- Using the PASTracks built-in scale position the base of the Spot Light sensor 20 cm from the Smart Phones Flashlight.
Software Setup
- Within the SPARKvue software Connect Wirelessly to both the Light Sensor and Smart Cart.
- Open the SPARKlab file ‘Inverse Square Law’ file which plots Light Intensity against Position with a 20 cm offset.
Collecting Data
- One person should be controlling the Smart Cart and Smartphone and another controlling the software
- Turn the Smartphone’s Flashlight on
- Click on the SPARKvue ‘Play’ button
- Slowly roll the Smart cart away from the Smartphone at a steady pace. The light sensor is only sampling at 2 HZ so moving too quickly will result in too few plotted data points. The Smart Carts position sensor will accurately record the distance that the Smart Cart travels
- Once the cart reaches near the end of the track stop the recording of data
Analyzing Results
- From the Tool box bar select the tool box icon to expand the bar
- From the expanded tool box select the ‘Scale to fit’ icon
- Next click on the ‘Curve to Fit’ icon and select the ‘Inverse Square Fit’ menu option
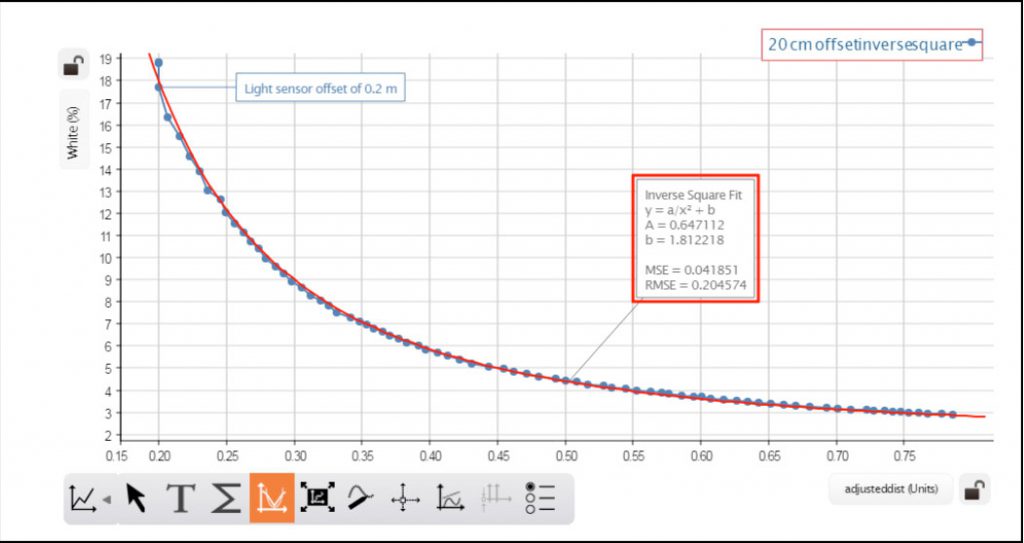
The Blue Line shows the connected data points of the light sensor readings plotted against the Smart Carts position sensor readings. The red line is the applied Inverse Square Fit. Notice how well the Inverse Square Fit curve matches the plotted data.