SPARKvue 4.0
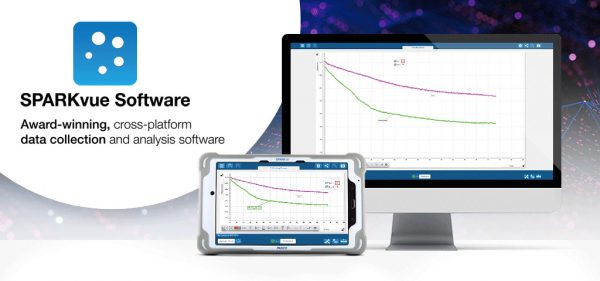
Why SPARKvue?
SPARKvue makes data collection, analysis, and sharing quick and easy on every platform. Compatible with all of PASCO’s wireless and PASPORT sensors, students can quickly set up their lab, or use a built-in Quick Start Lab and begin collecting data immediately. SPARKvue is for all sciences and grade levels. However, if you’re an advanced user looking for more capabilities such as video analysis, advanced statistics and calculations, and greater customization of data displays on a PC or Mac®, then check out our PASCO Capstone™ software.
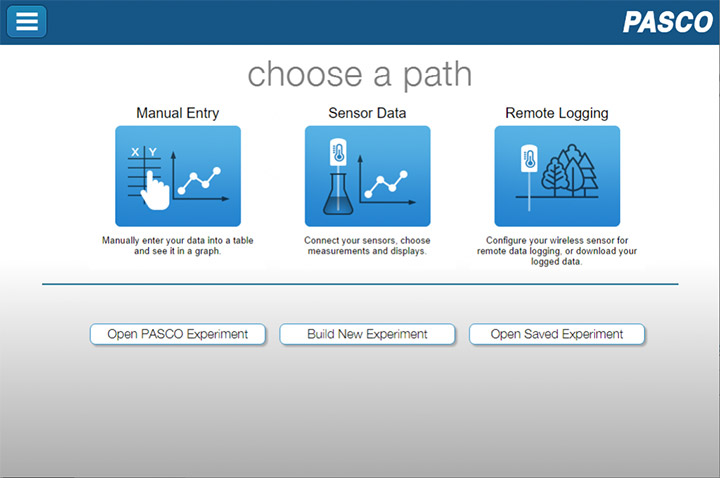
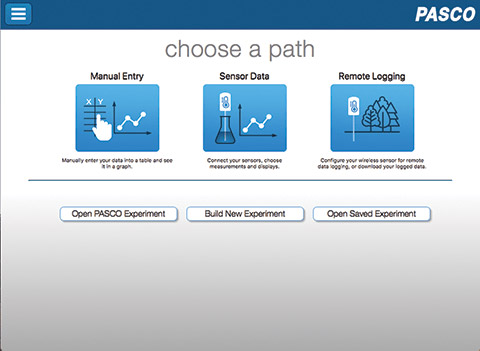
Since SPARKvue was first released, it has been winning awards, and we never stop improving it. With the latest major release of SPARKvue 4, we’ve continued to add features without adding complexity. A new Welcome Screen makes it easy to get started and discover SPARKvue’s capabilities. Whether you want to add data manually, use sensors for real-time or remote logging, or open one of the hundreds of existing labs, this is your starting place.
Data Collection
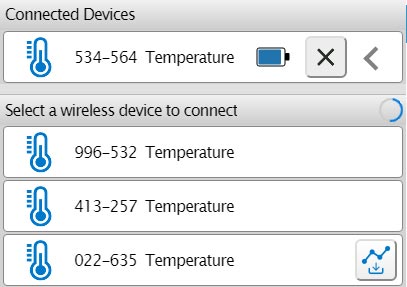
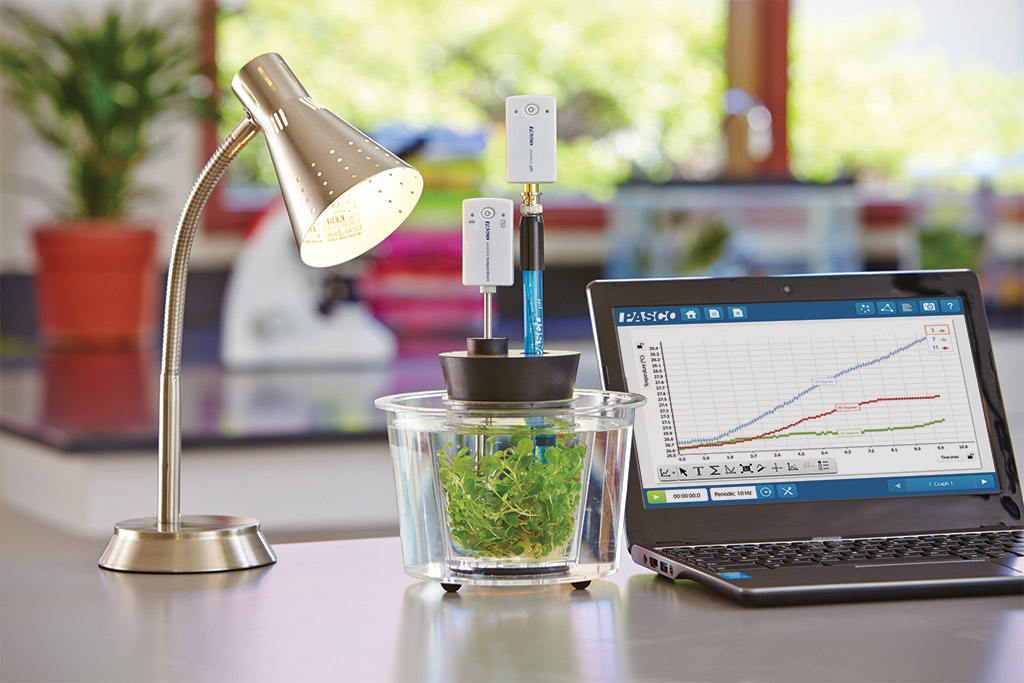
Using a USB or an interface, with SPARKvue you can just plug-and-play with nearly one-hundred sensors via Bluetooth®, which pairs wireless sensors through a simple in-app list (no system settings are required). PASCO understands that classrooms and labs can be hectic, so SPARKvue allows you to simply select a sensor from the sorted list (the closest sensors are first) and match a 6-digit laser-etched ID number to get connected. This method works even when there are dozens of Bluetooth sensors in the same lab.
Once you’ve selected a sensor, choose from a template or QuickStart Experiment, or you can build a page to meet your needs. SPARKvue is designed for inquiry, and students are not constrained to a few pre-selected layouts… the software can support expanding capabilities with ease.
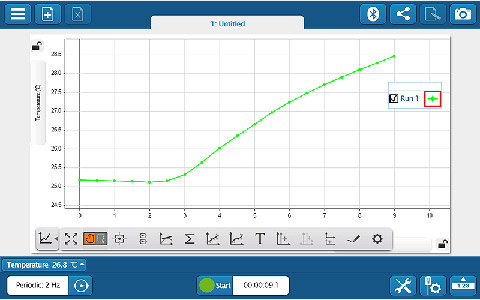
Collecting and visualizing data is easy with an array of displays, and the tools you need for analysis are right at your fingertips. Students can annotate data, apply curve fits, compare runs, create calculations, and much more! In-context tools make it simple to find what you’re looking for, which means that students spend their time learning the science, not the software.
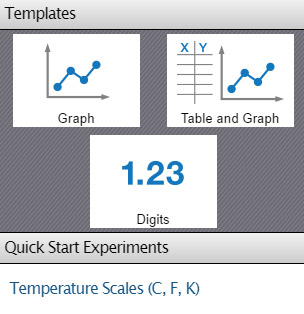
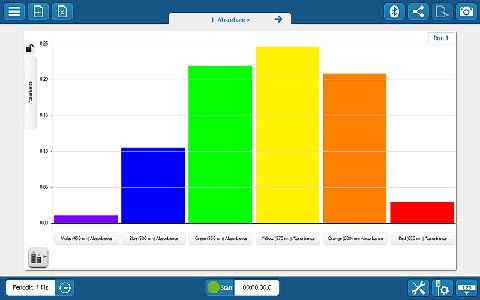
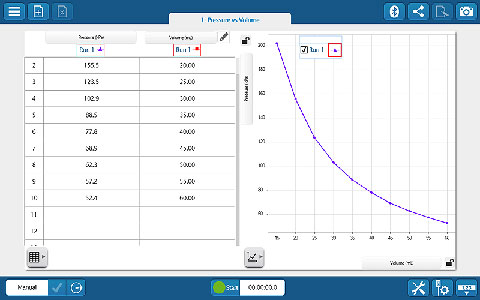
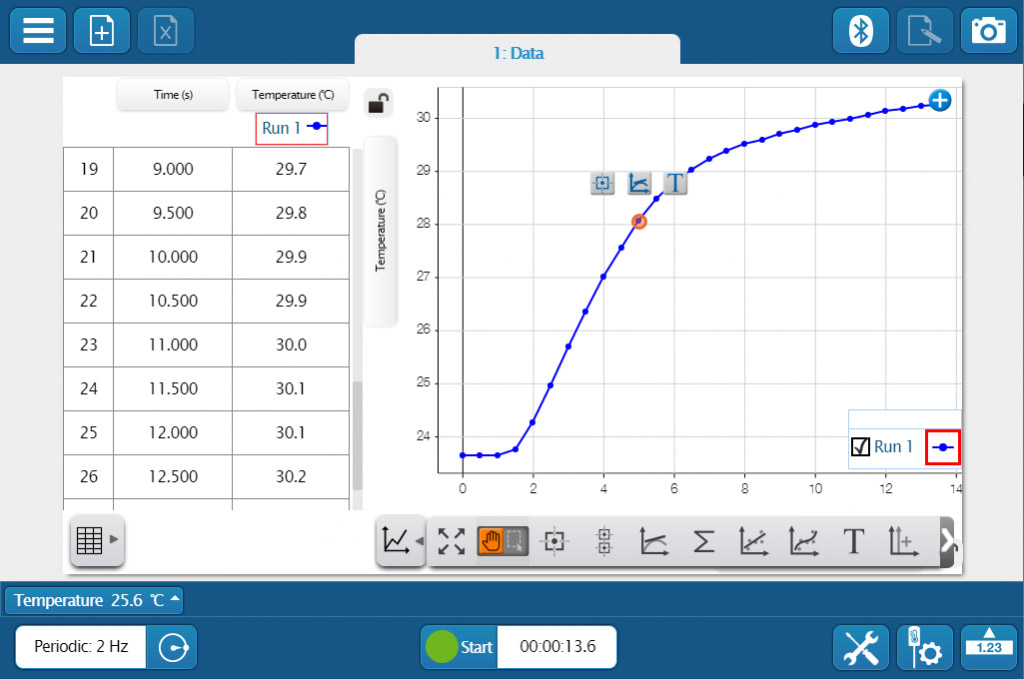 Whether you’re teaching K–8, high school, or college students, SPARKvue has the displays and tools you need to collect and analyze data. The basics you’d expect (such as digits, meter, graph, and table) are all included, but you will also find FFT, bar graphs, map display, embedded assessment questions, video playback, image capture, and analysis, as well as space for text and images. The labs you can build are only limited by your time and creativity.
Data Sharing and Export
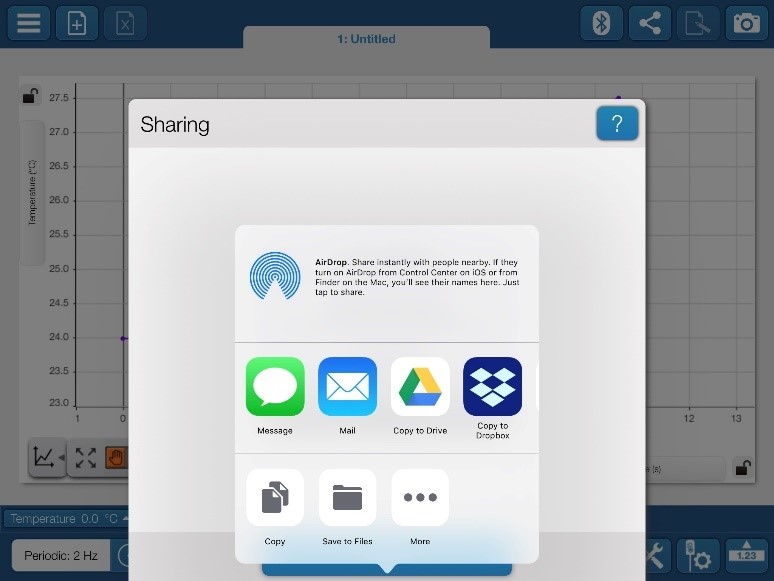
When it’s time for students to submit their work, SPARKvue supports a variety of formats, and its export tools make it easy for educators. Students can easily snapshot their work in SPARKvue and submit an image, export the data to a .csv file to work in a spreadsheet, or save it in our .spklab format when they can come back and do more work in the future. SPARKvue also supports many other apps for saving or sharing data, including Google Drive on Chromebooks™.
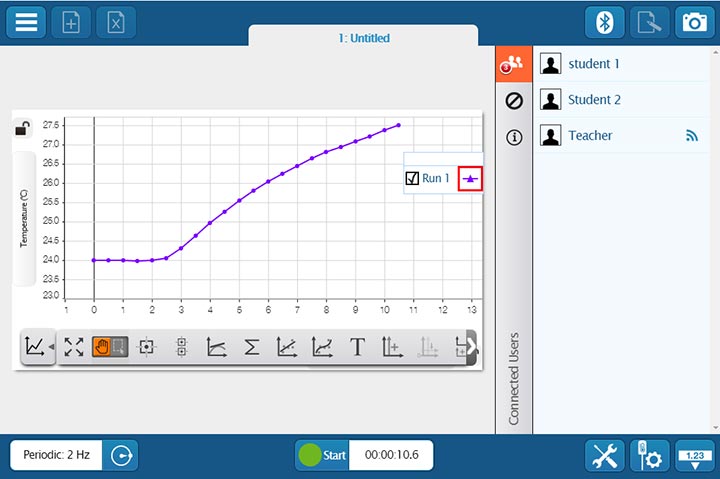
 If students are collaborating on a lab activity across devices, they can set up a shared session and stream results in real-time. Then, when the session is over, each student will have a copy of the data to analyze independently. These sessions can be set up in seconds within a student group, or the entire class can share the data from a teacher demonstration.
Data Collection
- Live Data Bar: See sensor readings before you start sampling.
- Periodic sampling: Automatic sampling proceeds at a fixed rate.
- Manual sampling: Saves data only when a user specifies.
Data Displays
- Graph, including multiple plot areas and axes.
- Digits
- Meter
- Data Tables
- FFT
- Map Display
- Bar Graph
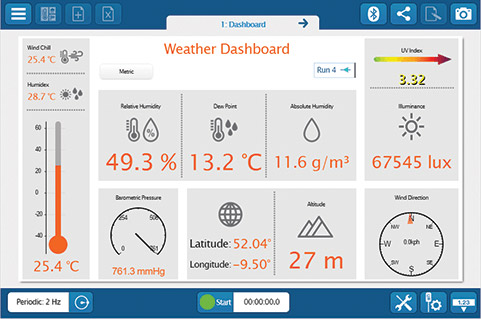
- Weather Dashboard (when used with the Wireless Weather Sensor with GPS)
Analysis Tools
- Scale-to-fit: Adjust axis for optimal view of the data.
- Data Selection: Easily select a portion of the data for analysis.
- Prediction Tool: Visualize a prediction alongside the data.
- Smart Tool: Find data point coordinates and calculate delta values.
- Calculations Tools for Statistics: Easily get basic statistics (min/max/mean) and more.
- Slope Tool: Find the slope of a point.
- Curve Fits: 10 different curve fits with goodness of fit values.
- User Annotation: Easily add text annotations to runs or points.
- Easily add a y-axis or a new plot area.
Designed for Science Learning
- Convenient annotation, snapshot, and electronic journaling are among the features that support peer dialogue, classroom presentations, and assessment.
- Create and export electronic student lab journals.
- Integrated with cloud-based file-sharing services such as Google Drive, Dropbox, and more.
The Same User Experience Across:
- Computers
- Chromebooks™
- Tablets
- Smartphones
- PASCO dataloggers
More Features
Download:
Download the latest update or give it a try for free.
Windows® Computers
- Filename: SPARKvue-4.3.0.10.exe
- Filesize: 250.32 MB
- Version: 4.3.0
- Released: Dec 13th, 2019
Download Free Trial Download Update
Mac® Computers
- Filename: SPARKvue-4.3.0.10.dmg
- Filesize: 132.67 MB
- Version: 4.3.0
- Released: Dec 13th, 2019
Free Apps for iPhones, iPads, Android tablets and Chromebooks
These SPARKvue apps provide the complete software install so that the user experience is the same regardless of platform. Updates for these apps are handled via direct notification and installation on your device, including SPARK LX/LXi users.


System Requirements
Windows
- Windows 7 SP1 or later
- Processor: 2 GHz or greater
- RAM: 2 GB or greater
- Disk Space: 459 MB or greater
- Resolution: 1024 x 768 or greater
Mac
- Mac OS X v 10.11 or later
- Processor: 1 GHz or greater
- RAM: 2 GB or greater
- Disk Space: 202 MB or greater
- Resolution: 1024 X 768 or greater
Chromebook
- Chrome OS v70 or later
iOS
- iOS v9 or later. Compatible with iPhone, iPad, and iPod touch.
Android
- Android v5.0 or later. Compatible with tablets or phones.
About The Free Trial
- This is a fully-functional 60-day free trial of SPARKvue software for Windows or Mac Computers.
- After the 60 day trial, a licensed version of SPARKvue will be required to continue.
- The full version of SPARKvue is also available as a free app for iPads, Android tablets, and Chromebook devices.