Acceleration and velocity are present everywhere in life, from sports to driving, to walking around. With PASCO’s Wireless Acceleration Altimeter, I decided to see what I can learn from the 7 different data points that it records.
As a hockey player for 18 years, I’ve always wondered how quickly I’m moving on the ice, having never seen myself skate or recorded my speed. I assume of course, that I am right up there with Connor McDavid in terms of speed. I expect the sensor to be able to confirm that for me, while also telling me even more information – my acceleration and velocity in the x, y, and z directions.
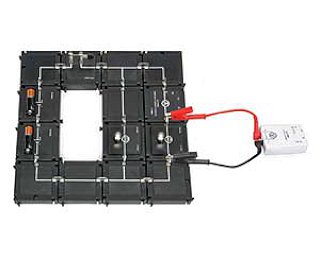
The first step in my experiment was to put the sensor into remote data logging mode, so that the altimeter is recording data into its internal storage, instead of needing to be connected to a phone or computer.
When setting up the altimeter, I changed the frequency to 5 Hz, (5 data points per second). The altimeter can record up to 200 Hz but has a limited capacity for how much data it can keep in its internal storage. Once I had put the sensor into remote data logging mode, I used the included Velcro straps to attach it to the back of my shin guard and got ready to step onto the ice.
For the first 9 minutes of the data recording, I am putting all of my equipment on, so the velocity and acceleration are relatively low as I stay within the dressing room. At the 10-minute mark warm-up begins. For these 5 minutes, I’m constantly moving while I’m skating on the ice, so the acceleration is constantly changing and staying at numbers of higher magnitude.
The magnitude of the data is also slightly decreasing during the 5-minute stretch as I slow down and conserve more energy for the game. When comparing the peaks of this stretch to the peaks of acceleration later on, it’s clear that I wasn’t accelerating as much in warm-ups as I would be when I was playing the game.
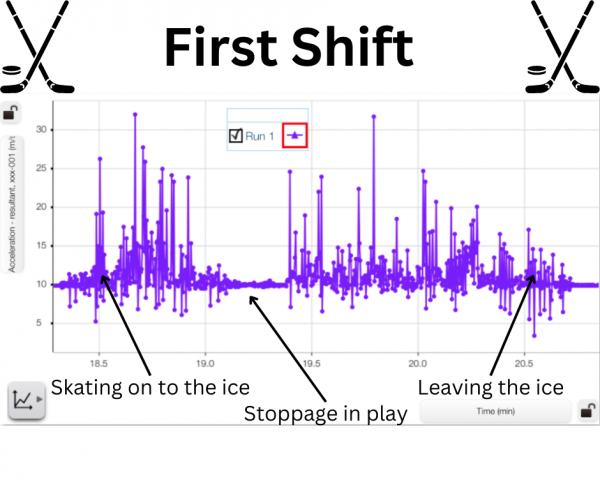
At the 15-minute mark, the game begins and I’m on the bench for the first shift, but at 18.5 minutes I get on the ice. There are bursts of acceleration as I get up to speed and little sections of coasting until 19 minutes when there’s a stoppage in play and the acceleration goes down and remains relatively constant. When the play resumes my acceleration begins to spike and then fluctuates throughout the natural progression of the game, as I coast at times and race to get the puck at others.
Over the course of the rest of the game, the peaks and valleys of the graph show clearly when I was on the ice accelerating and decelerating, and when I was on the bench, with the little movement just being from sliding across the bench or standing up to cheer on a goal.
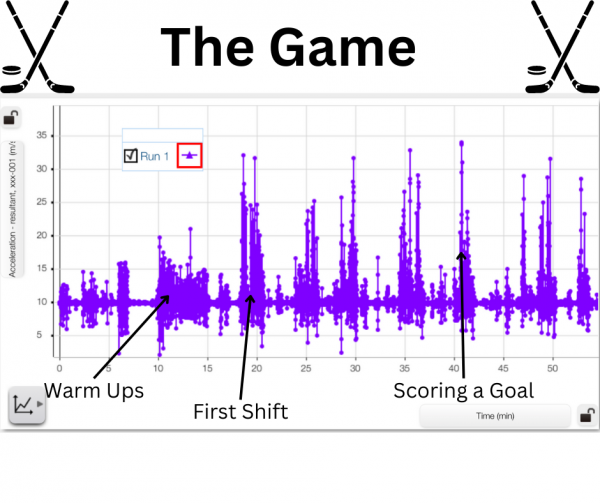
In the different peaks in the graph, it can be seen which shifts I accelerated the most, and which I had a bit less energy. On the first shift of the game, my peak acceleration is 32 m/s2, which is high, but not the highest acceleration of the game. On this shift though, there are 60 data points where my acceleration is greater than 15 m/s2.
Because we are recording at 5 Hz, we can take that to mean that there are 12 seconds in which my acceleration is greater than 15 m/s2. This is not all in one 12-second stretch though, it’s spread out throughout the shift in groupings or bursts of acceleration. By comparison, the shift with the next highest amount of data points over 15 m/s2 is my 4th shift, in which there are 50 such points, or approximately 10 seconds. This 2-second difference is evidence to point towards my fatigue, as the number of such data points decreased more as the game went on, with the final full-length shift containing only 34 of these points (6.8 seconds).
The highest acceleration recorded is 34 m/s2, and that is on the 5th shift of the game. It would seem abnormal that my highest acceleration would be on the 5th shift, as I am already more tired at this point. There is context to explain the abnormality though – on the 5th shift we broke out on a 2-on-1 and I had to accelerate as fast as I could to free myself up to receive the pass and score a goal.
Overall it was a very interesting and insightful experience looking into the data surrounding my skating and gameplay. While I don’t think my acceleration is quite up to par with Connor McDavid, I can say I’m satisfied with my results and happy that the data logging had ended by the time I ended up in the penalty box.
With the Acceleration Altimeter, there are so many cool and interesting ways to record and examine data, and I got a fascinating look at just one of the possibilities by taking it with me during my hockey game. Additionally, there are other data points that weren’t useful for my experience, with angular velocity, altitude, and acceleration in the z direction – playing hockey on a flat sheet of ice somewhat limits how much vertical movement can be performed. I’m excited to dig deeper into the data and for other possibilities and opportunities in the future to learn more, using PASCO’s wireless sensors.
Featured Products:
Wireless Accelerometer/Altimeter
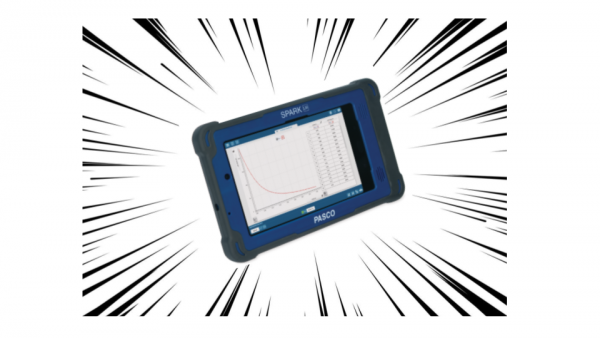
SPARKvue


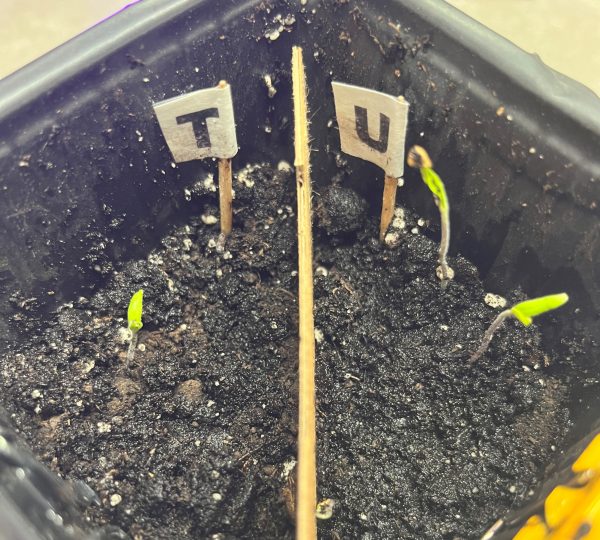
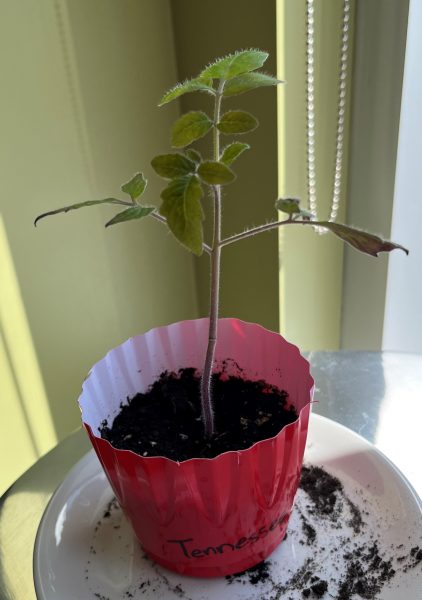
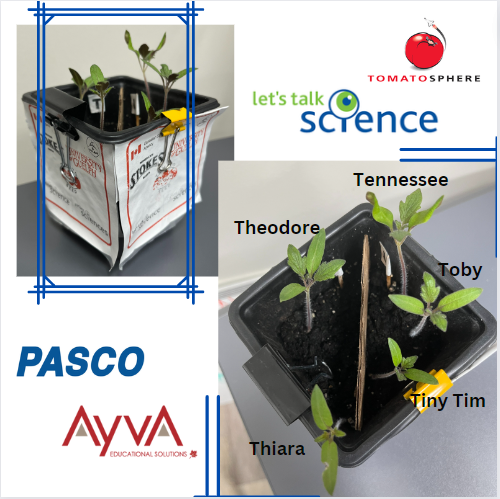 After just one week of being inside the Greenhouse, three out of six seeds germinated and sprouted! As a couple more weeks went by, two more seeds sprouted. Unfortunately, one seed (on the T side) did not germinate. Overall totaling three plants on the U side, two on the T side. At this point, we hypothesized which of the seeds had been to space and which had not, and wrote down our predictions to compare to the results later on. You can share your predictions in the survey at the bottom of this post, and find out which seeds were the space seeds!