The Beauty of Periodic Motion: A Capstone Observation Experiment
As a third-year Biomedical Engineering student at the University of Guelph, learning throughout this pandemic has been especially difficult, but why? It’s all the same materials. The same teaching style. I can even choose my learning environment and mitigate distractions.
For me, the biggest thing that has been missing throughout this pandemic has been experimentation, but more specifically, labs that push students to apply their knowledge to their own observations or to the world around them. During this pandemic, I took a course called Biomechanics as an extracurricular. Without a doubt in my mind, this course ignited my passion for practical application. Students were required to observe, collect, and write three different labs, all centered around the biomechanics of crutch walking. After learning to use a goniometer, force plate, EMG sensors, and 3D modelling software, students then created their own biomechanics experiment.
This is where the real learning begins.
What does this have anything to do with harmonics or even Capstone, you may ask? The point I am trying to make is that you can throw complicated laws and theorems a student’s way. However, they won’t understand it until they begin to connect these laws to the world around them. Every student has asked, “When will I ever use this?” but rarely do you ever find a student who seeks the question “How does this affect the world around me?” As such, I wanted to pose a simple question that pushes students to connect their knowledge outside the classroom.
What are some examples of harmonic motion in your daily life?
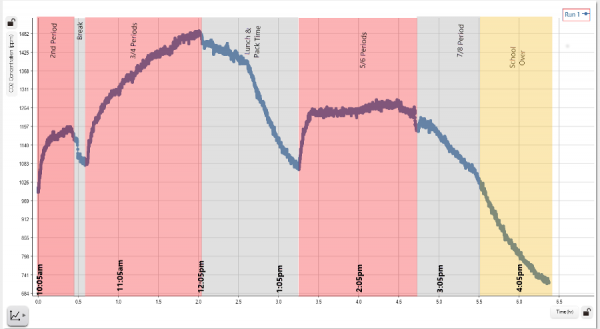
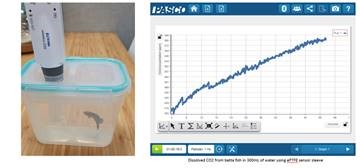
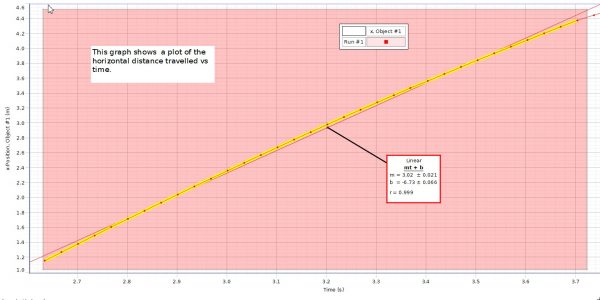
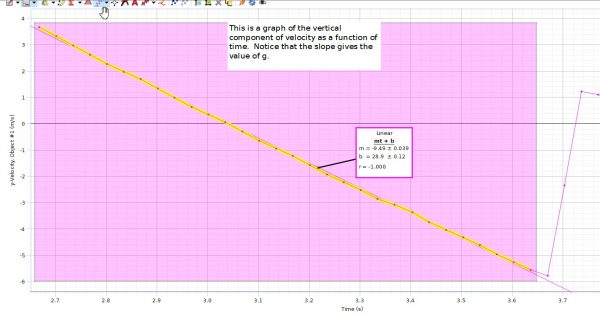
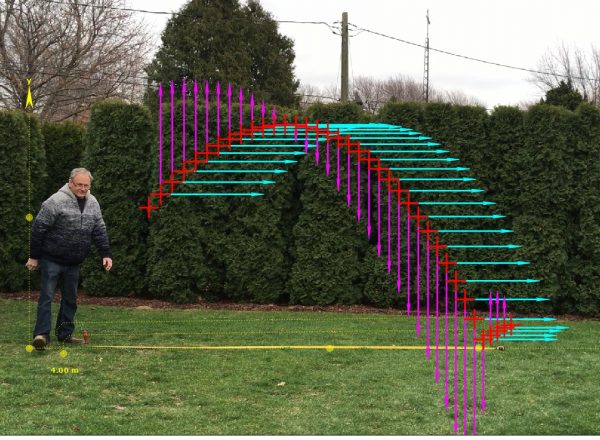
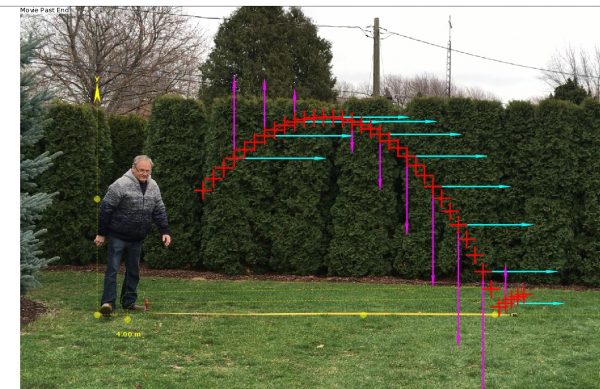
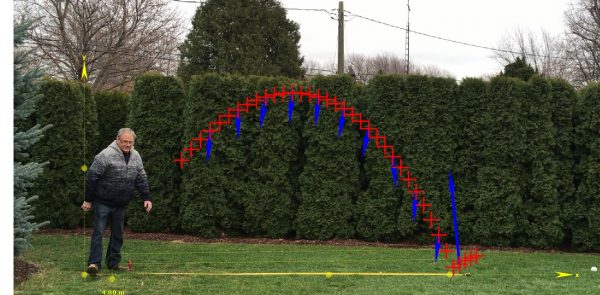
This question is really nothing special, but it can be easily observed and analyzed with little to no equipment. For this example, I used PASCO’s Capstone Software going frame by frame to analyze the motion of various objects and graphing the vertical position (meters) versus time (seconds).
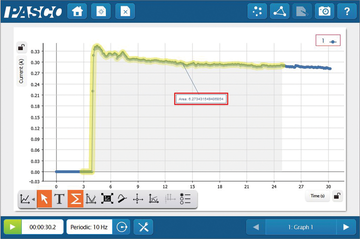
The first example of harmonic motion was the spinning of a bicycle wheel, which was suspended to have no contact with other objects. Three different examples of periodic rotation were observed using the Capstone software and a bright green piece of tape.
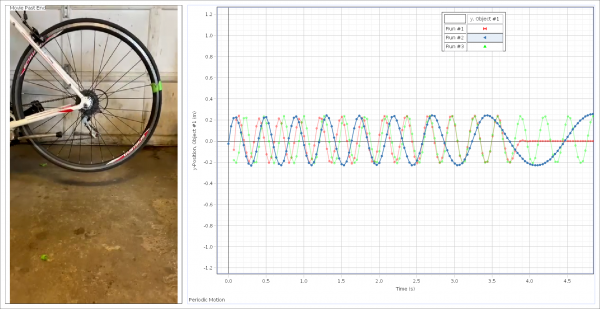
The green line represents a graph that has no brakes applied, the blue line represents a system with light braking pressure, and the red line represents a system with full braking.
From the data collected, it was observed that as the brake pressure is increased, the period of the oscillator decreased. This trend is essential for students to understand as it raises the question of braking distance and the effects of friction on a periodic oscillator.
The next example of harmonic motion was car suspension. The system represents a driven harmonic oscillator as most car suspensions will be critically damped or have some sort of dampening. For this experiment, I highly recommend filming the oscillation in real-time with an additional light source. The top of the spring was tracked throughout the cycle and plotted on a vertical position vs. time graph.
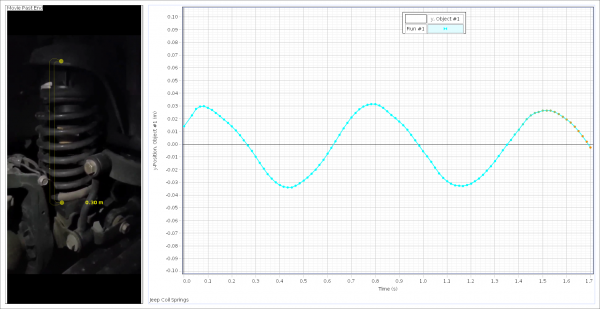
The blue line represents the effect of the applied force on the vertical position (meters) of the spring vs. time (seconds).
As a final example of harmonic motion, the E-String of a guitar was filmed using the slow-motion setting on a phone, shooting at about 960 fps. String harmonics are incredibly difficult to capture, and for a more accurate measurement, I highly recommend the use of a slow-motion camera. As an alternate example of harmonic motion, I recommend a swing, metronome, or any pendulum clock.
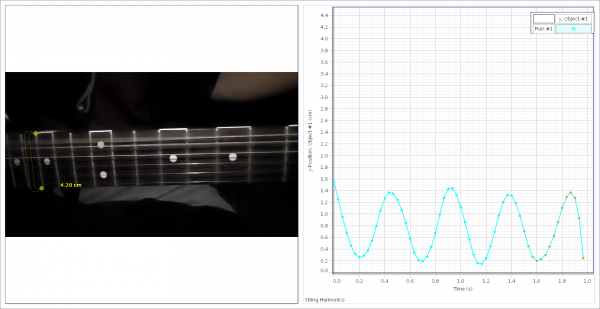
This graph represents the vertical position (centimeters) of the guitar string vs. time (s).
Laboratory experimentation is usually very equipment-heavy, which prevents students from observing the effects of the laws and theorems on a day-to-day basis. The difficulty of tracking time, position, or other factors removes focus from the real learning and can often times impede a student’s understanding. The best way to foster a student’s understanding is through their own curiosity.