English | Français

TQ Blog: Aerospace Equipment for Solihull College

Originally published on TQ’s website on Oct 8, 2018: https://www.tecquipment.com/case-studies/aerospace-equipment-for-solihull-college

Solihull College Uses TecQuipment Products for Teaching Aerospace Engineering and Maintenance Degree Students.

Solihull College and University Centre recently introduced an Aerospace Engineering and Maintenance Degree. A new facility was created, which required a substantial investment in specialist aeronautical educational equipment to teach everything from the basic theory of flight looking at drag and lift equations through to more advanced topics that look at boundary layers, pressure distribution and wake investigations. This was part of a £2.5m spend on the aviation and aeronautical facilities at the Woodlands campus of Solihull College and University Centre.

“After inviting companies to bid for the new equipment, we selected TecQuipment based on the premium specifications, competitive price, and reputation for quality of service supported by the excellent pre-sales experience,” commented Paul Matthews, Senior Lecturer and Coordinator at Solihull College.

Teaching Fundamentals of a Jet Engine

For teaching students how single shaft gas turbines on aircraft work, the College purchased a GT100 Turbo Jet Trainer. Powered by Kerosene, students can accurately replicate the behaviour of a single-shaft gas turbine that would be used in aircraft. The self-contained design allows students to learn the following:

  • Effect on thrust generation by variation in rotational speed and propelling nozzle area
  • Isentropic, polytropic and mechanical efficiencies of compressor, combustion chamber and turbine
  • Pressure ratios of turbine, compressor and nondimensional characteristics
  • Combustion chamber pressure losses and combustion efficiencies
  • Specific fuel consumption, thermal efficiency, air standard cycle, work ratio and heat balance
Turbo Jet Trainer
Turbojet Trainer uses Kerosene to replicate the behaviour of a single-shaft gas turbine.
Firing up the Turbojet Trainer.

Theory of Flight

In addition to the BSc degree course, Solihull College also offers a HNC in aircraft maintenance, and a HND.

Salman Javed, Aerospace Lecturer at Solihull College explained “Rather than the BEng version of an aerospace engineering degree that focus on the design of aircraft, the BSc is designed to be more-hands on. This focus means that practical experiments play a greater role in the learning process.”

The aerodynamics lab has an array of different pieces of apparatus for teaching all of these courses.

Aerodynamics Principles

For teaching the foundations of aerodynamics, Solihull College purchased an AF1300 Subsonic Wind Tunnel. This is part of an extensive range of wind tunnels available from TecQuipment for teaching aerospace engineering students. The AF1300 Wind Tunnel sits in the middle of the TecQuipment wind tunnels range, is compact enough to be moved around on wheels, and yet has the functionality to allow students to perform experiments to understand the following:

  • Investigations into boundary layer development
  • Influence of angle of attack on aerofoil performance
  • Flow past bluff and streamlined bodies with pressure and velocity observations in the wake
  • Performance of an aerofoil with flap, influence of flap angle on lift, drag and stall
  • Pressure distribution around a cylinder under sub and super-critical flow conditions
  • Study of characteristics of models involving basic measurement of lift and drag forces
  • Study of the characteristics of three-dimensional aerofoils involving measurement of lift, drag and pitching moment
  • Study of the pressure distribution around an aerofoil model to derive the lift and comparison with direct measurements of lift
  • Flow visualisation
AF1300
The AF1300 Subsonic Wind Tunnel is a compact, practical open-circuit suction wind tunnel for studying aerodynamics.
AF1300 Paul
Senior Lecturer Paul Matthews explains the basic theory of flight to a group of students.

Advanced Aerodynamic Theory with Supersonic Studies

For more advanced understandings, the College added an AF300 Intermittent Supersonic Wind Tunnel to their laboratory. At the easier end of advanced theory students can learn about nozzle pressure distribution, analyse Mach numbers and then use the Schleiren apparatus to measure and visualise pressure and shock waves on a model.

TecQuipment offers two supersonic wind tunnel options, the Intermittent and Continuous Supersonic Wind Tunnel. For budget, easy lab set-up and result accuracy reasons, Solihull College opted for the Intermittent Wind Tunnel, which stores compressed air in tanks – in this case a line of three tanks, which induces a flow in the working section of the wind tunnel. This controlled air supply provides a more stable flow of air with filters and air dryers for accurate results that can be captured in a 5-10 second window. Once the experiment has run, the air tanks will refill for 3-5 minutes and then be ready to run an experiment once more.

The Schlieren Apparatus allows students to see density gradients as variations in intensity of illumination, see for themselves supersonic air flow around models, plus shockwaves and expansions. A series of mirrors and lenses allow the student to see the results as they happen, while a digital camera records them for later reference. The recording functionality is particularly useful when sharing the results with a group of students.

Watch the video below for more…

The PASCO Bluetooth Spectrometer: Even Isaac Newton would flip over the power of this digital prism!

Reposted from the NSTA Blog, original article can be found here.

The PASCO Wireless Spectrometer

Simply put, constructivism is a theory of knowledge that argues that humans generate knowledge and meaning from an interaction between their experiences and their ideas. So it follows that nothing is can be more constructivist than exploring the theoretical with real-time tools that measure the invisible. And the PASCO Wireless Spectrometer is just such a tool.

One of the most amazing things about the PASCO Wireless Spectrometer is that it does exactly what you would want it to do; show you the invisible with ease, simplicity, and leave behind a useful digital paper trail of graphs and charts. Although the main purpose of the PASCO Wireless Spectrometer was “specifically designed for introductory spectroscopy experiments” it actually goes farther than that. Much farther. Much much farther!

This trio of teachers, two from China and one from Mongolia have limited English speaking skills, but instantly understood the iPad app and PASCO Wireless Spectrometer. Seems that light is also a universal language.

The physics and electronics behind the PASCO Wireless Spectrometer are straight forward. The output is clear and obvious. And the mobility aspect is unprecedented. In other words, it does what it should how it should. Amazing enough on its own, but in true paradigm shifting fashion the PASCO Wireless Spectrometer presents the invisible world of visible light in the magical cartoon chart we’ve seen only in static textbooks for most of our lives. It’s as if the dinosaur skeletons in dusty museums suddenly came alive and reacted to the world.

Visible light, or the light our human eyes sense and convert to electrical impulses to our brains, only encompass a tiny fraction of the electromagnetic spectrum. Wavelengths between 390-700 nanometers, or from the short blue/violet waves to the longer orange/red ones with green and yellow in the middle. Infrared waves are just a little too long for us to see, and ultraviolet ones are a little too short. Even longer are radio waves, and even shorter are x-rays. The PASCO Wireless Spectrometer has a range of 380 to 950 nanometers meaning it can “see” a little into the ultraviolet and a lot into the infrared.

An ultraviolet light spikes the graph just outside the shortest wavelength we can see with our eyes.

Where this all comes together is that when the PASCO Wireless Spectrometer and various light sources are manipulated with our hands, the extended visible spectrum becomes something we can explore with the same cognitive dexterity as the microscope affords us in biology. When used in the classroom for demonstrations and explorations, the PASCO Wireless Spectrometer literally lets “humans generate knowledge and meaning from an interaction between their experiences and their ideas.” So yes, the PASCO Wireless Spectrometer is the epitome of constructivist theory into educational practice.

Isaac Newton

Although Isaac Newton is credited with discovering the inner workings of visible light back in the latter 1600s, the basic concept behind a rainbow was suggested by Roger Bacon 400 years earlier who in turn drew upon the works of Claudius Ptolemy a millennium before, and even Aristotle another 300 years before that.

Roger Bacon

Claudius Ptolemy

Aristotle

As a quick digression here, the Newtonian physics behind the PASCO Wireless Spectrometer has roots much more than five times deeper into the past than Mr. Newton’s distance in time is from us right now. Sorry to go all Einstein on you, but the individual colors of visible light that Newton coaxed out of sunlight with only a glass triangle, and then reassembled with nothing more than a companion prism was like yesterday.  Yet the attempts to explain the phenomena were first floated last week.

And now to think that within the palm of a student’s hand and the screen of their iPad is a gift of knowledge as great as the discovery itself. A stretch? Perhaps, but unless a scientific concept can be truly understood to the point one can make personal meaning out of the discovery, memorized facts are little more than coins used to buy grades.
Technically speaking, the PASCO Wireless Spectrometer is a battery operated spectrometer that uses Bluetooth wireless or a USB wire in order to communicate with a computing device running the necessary software. With its own built-in LED-boosted tungsten light source and three nanometer resolution, the PASCO Wireless Spectrometer provides an exceptional tool for traditional experimentation with pl
enty of room left over to inspect rarely explored specimens of light scattered throughout our lives.
The operation of PASCO’s unassuming black brick puts the power of spectrometry into the hands of grade school students and Ph.D. candidates alike. While maybe not the most durable block in the scientific toy box, the PASCO Wireless Spectrometer does offer a level of simplicity (when desired) as easy to use as  glass prism and sunlight. Of course you can do much more with the PASCO Wireless Spectrometer, but you don’t have to in order to get your money’s worth. This spectrometer does so much so well so easily that it literally rewrites lesson plans just by walking into the classroom.
On a higher level, the PASCO Wireless Spectrometer can be used in chemical experiments of intensity, absorbance, transmittance and fluorescence all while using a device that, according to PASCO, has light pass through the solution and a diffraction grating and then a CCD array detects the light for collection and analysis. Sounds simple enough just like a digital prism should. Except this one gives about nine hours of service per battery charge.
In the off chance that the battery fails, it is user-replaceable. in the off chance the light burns out, it is user-replaceable. And in the likely chance that liquid from a cuvette spills into the holder, a drain hole limits the damage, and cleaning the holder is user-serviceable with a cotton swab and deionized water.

A portable studio light is used to provide a background of predictable photons in order to explore the absorbance properties of various types of matter including sunglasses, polarizers, fabric, and theater lighting filters.

The PASCO Wireless Spectrometer must interface with a computer or tablet. Both Mac and Windows are supported as is iOS and Android.
You can download the Spectrometer user guide here.
PASCO also suggests using the Wireless Spectrometer for the following popular labs:
  • Absorbance and transmittance spectra
  • Beer’s Law: concentration and absorbance
  • Kinetics
  • Fluorescence
  • Photosynthesis with DPIP
  • Absorption spectra of plant pigments
  • Concentration of proteins in solution
  • Rate of enzyme-catalyzed reactions
  • Growth of cell cultures
  • Light intensity across the visible spectrum
  • Emission spectra of light sources
  • Match known spectra with references
And PASCO also provides several sample labs for plug-and-play directly into the chemistry classroom. But the really exciting plug-and-play option is the accessory fiber optic probe. With no more effort than sliding a faux cuvette into the receiving slot on the spectrometer, a meter-long fiber cord moves a directional sensor out into the wild where it can capture photons from all kinds critters. Some of my favorite animals include UV lights, filtered lightbulbs, various school lighting sources, sunlight though sunglasses, polarizers, and pretty much any LED flashlight I can find, especially the really good ones.
Although the screen output from the PASCO Wireless Spectrometer’s software is a graphical representation of a physical property, it takes almost no mental gymnastics to understand the changes to the graph once your mind is oriented to the display. The color-coded background and gesture-ready scaling provides an exceptionally smooth relationship with the data to the point all the hardware and software disappear leaving only the experiment and the results. And in my book, that kind of invisibility is the true measure of success with a teaching product.
When teaching the next generation about the important discoveries of the past generations, we have an obligation to use the most powerful educational tools possible. The PASCO Wireless Spectrometer is truly 100% pure constructivism-in-a-box. It turns experiences and ideas into personal meaning. Battery included and no wires necessary.
This entry was posted in NSTA Recommends: Technology, Science 2.0 and tagged Spectrometer, wireless.

PASCO Capstone 2 Software

CAPSTONE 2.0 is out now! Free Upgrade for Capstone 1.x users!

Updated with new tools! Designed specifically to collect, display and analyze data in physics and engineering labs.

Features for Capstone 2.0!

Blockly Coding

Helps Students Develop Computational Thinking Skills

Physics educators want more experimental control and programming access to all PASCO interfaces and sensors. Students need tools to develop creative programing and problem solving skills in science. Blockly coding has been built into Capstone 2, giving teachers and students the tools they need to develop these skills.

With PASCO Capstone In Your Lab:

  • Apply coding concepts to your labs
  • Create new sampling conditions
  • Design Sense and Control experiments
  • Create whatever experiment you or your students can dream up!
Capstone Blockly Graph

Trials Table – Coming in 2020!

Capstone Trials Table
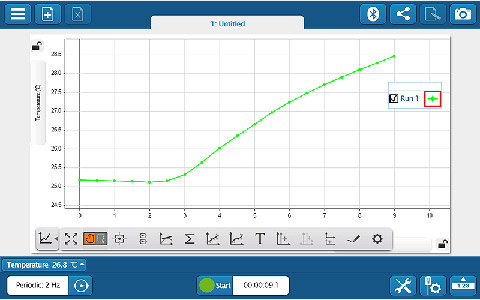
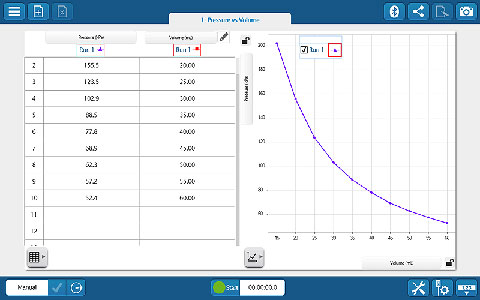
You never take only one run in science. You take multiple runs and calculate averages. Next, you vary a parameter while holding the other constant; again, taking more runs and calculating averages. Most software data tables don’t actually allow this to be done easily.

The Capstone Trials Table was created for how data is collected in the science lab and allows for the kind of analysis students need to perform.

  • Organize your data to easily define physical relationships
  • Track variables
  • Average runs
  • Plot derived values

Capstone Mass of Pendulum
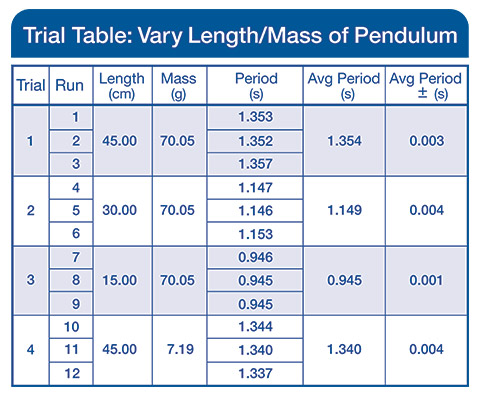
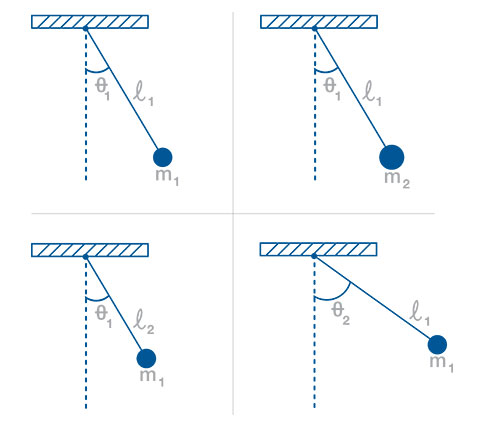
Using the simple pendulum lab as an example, students will time a simple pendulum under various conditions. They will vary the mass, length, and starting angle. The Capstone Trials Table allows you to vary and keep track of experimental parameters between trials and runs taken in each trial. You can also keep track of statistics for averaged runs and experimental error.
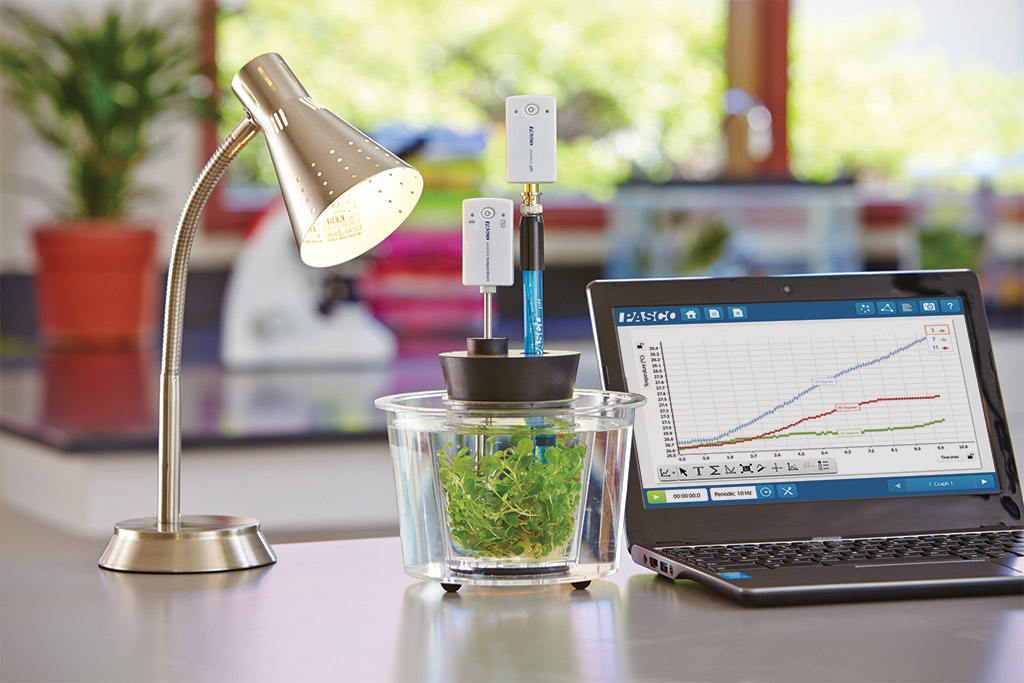
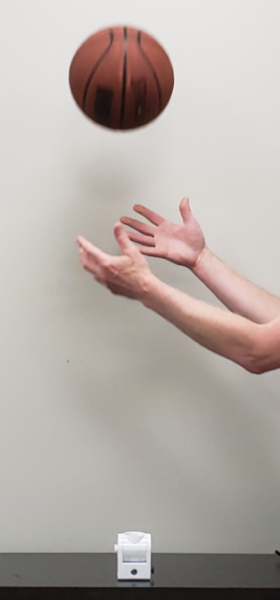
Real-world Science

Scientists always take multiple runs and calculate averages. Next, they vary a parameter while holding the others constant; again, taking more runs and calculating averages. Most software data tables don’t support this and require data export and processing… until Capstone 2.

The Capstone Trials Table was created to reflect how data is collected in science labs. It supports the analysis students need to develop critical thinking skills and interpret the data.

With Capstone students can:

  • Organize data to easily define variable relationships
  • Track multiple variables
  • Average runs within a trial group
  • Plot derived values (such as an average of runs vs. a group parameter)

For example, in the Simple Pendulum lab, students time a pendulum under different conditions by varying the mass, length, and starting angle. The Capstone Trials Table allows you to manipulate variables and track experimental data between trials and runs. You can also keep track of statistics for averaged runs and experimental error.


Graph Pop-Up Tools

Now, whenever tools are activated, the most common actions will be easily accessible on the graph. The pop-up tools allow for easy access to tool features and options.

Capstone Graph Pop-up Tools


Circuits Emulation

Reinforce circuit concepts and tackle student misconceptions using circuit visualization. Combine real-world circuits with simulations, animation, and live measurements. Drag components from the components list, then rotate them and connect pieces together by drawing wires.

With the Circuits Emulation tool in Capstone 2, you can:

  • Construct and modify circuits
  • Show conventional current and electron flow animation
  • Animate circuits with live sensor data

Drag components out from the components list. Rotate components and connect pieces together by drawing wires.

Capstone Circuits Emulation Screen Example

AYVA and Pignat host Thompson Rivers University in Lyon


Last week Max Tinsley and Amie Schellenberg traveled to Pignat’s manufacturing plant in Lyon, France to test and approve the first of 12 Process Control units being custom built for Thompson Rivers University’s (TRU) new Instrumentation program in Kamloops, BC.

Pictured above are Max Tinsley, Instrumentation Instructor with Régis Rodriguez, Pignat’s Product Specialist.

Régis has traveled extensively in Canada to install a broad range of Pignat equipment in colleges and universities, and to train the staff and faculty. But for large projects, we encourage customers to visit the factory to meet the design and engineering team prior to us shipping the equipment. Thank you to Amie for sharing this photo and for her kind words about the trip.

Waterloo’s World Class Chemical Engineering Labs

The Chemical Engineering Department at the University of Waterloo continues to expand their training equipment in the undergraduate labs, providing students with real world hands-on experience.

The left picture is the TUV/3000 UV Disinfection and TOC Reduction Unit, the right picture is a custom designed OTP-ABS Controlled Absorption & Regeneration pilot plant.

As with all training systems manufactured by Pignat and supported by AYVA, a factory engineer installed and commissioned the equipment and provided staff and faculty with the necessary training.

AYVA’s Chief Technology Officer was also present to supervise the electrical inspection and assist with a maintenance plan.

The Physics of Kawhi Leonard’s Incredible Buzzer Beater

It was the shot heard across Canada.  There were a lot of factors that made Kawhi’s buzzer beating basket so remarkable.  Aside from there being no time left on the clock and the weight of a sport’s nation on his shoulders, Kawhi had to overcome the backward momentum that is inherent in a ‘fadeaway’.  The purpose of a fadeway is to create space between the shooter and defender(s), which was a necessity for Kawhi as there were several seriously tall 76ers trying to screen his shot.

Over-coming the fadeway’s backwards momentum is no easy feat as it requires players to quickly calibrate in their minds the additional force that is required to successfully sink a basket, which for most mere mortals is not intuitive.  The shot is so challenging that only a handful of NBA basketball players have been able to reliably make this shot; and we’re talking the great players such as Michael Jordan, Lebron James, Kobe Bryant and of course Kawhi Leonard.

The video below provides an extreme example of backwards momentum with a soccer ball shot from the back of a truck

Investigating Kawhi Leonard’s shot in the lab

In addition to backwards momentum there were many additional physical factors at play such as the angle of the shot and gravity.  Investigating all these forces in a single activity would not be practical.  Fortunately most of these forces can be isolated and explored in the lab using PASCO sensors, software and/or equipment.

Exploring The fadeaway’s negative momentum using PASCO

PASCO offers an intriguing and affordable solution to model the dramatic effect of a fadeaway’s negative momentum on projectile distance.  PASCO’s mini launcher will consistently launch projectile balls the same horizontal distance for a set angle, assuming that the launcher is stationary.  If however, the launcher is placed on PASCO’s frictionless cart, the force of pulling the trigger will cause the cart to move backwards at a velocity that can be measured using the motion sensor.  Students will be surprised to see that even though the cart travels just a few centimeters, the overall projectile distance is significantly reduced.  This can be a very simple demonstration or an in-depth quantitative analysis that factors in the projectiles initial angle and velocity, the time of flight and even the k-constant of the spring.

Other Forces Affecting a Basketball Shot

Momentum and Explosions

When a basketball player takes a jump shot (as with a fadeway), the player and the ball could be viewed as 2-object linear system if you ignore other outside forces such as gravity.  What’s interesting, and perhaps not apparent to many students, is that the basketball will exert an equivalent force to the player as the player is exerting on the basketball (Newton’s 3rd Law).  Of course because of the very significant inertia (mass) difference between the two objects, the basketball will accelerate at a much fast rate than the player.  The player however will experience some acceleration in the opposite direction to that of the basketball.

Using Smart Carts to explore Momentum and Explosions (Free Lab)

The Wireless Smart Carts are equipped with an exploding plunger.  Multiple 250g bars can be added to one cart to skew the masses.  The velocities of both carts are measured using the cart’s internal position sensors enabling students to determine that momentum is conserved in a linear exploding system.

ME-1240 Smart Cart (Red)

ME-1241 Smart Cart (Blue)

ME-6757A Cart Mass (set of 2)

Newton’s Third Law

The player’s force on the basketball will be equal to the opposing force of the basketball onto the player.  Of course most students will consider this a ridiculous proposition until they prove this for themselves.

Using Smart Carts to explore Newton’s Third Law

There are several ways the carts can be used.  The simplest activity is for two students to have a tug-of-war using the internal force sensors of two Smart Carts and an elastic band as depicted in the image.  The equal but opposite forces will be confirmed, however in relation to a basketball player taking a shot, it has some shortcomings as the forces are pulling as oppose to pushing.

An equally simple activity, and one more relevant to the basketball shot scenario, is to collide two Smart Carts (with magnetic bumpers attached to their force sensors).  As both carts have equivalent masses, students may not be surprised to see the impact forces are identical.  However, what will probably surprise your students, are the force measurements that occur during a collision when one cart is weighed down with one or more 250g masses.  Using their intuition, most students will speculate that one of the carts will experience a much greater force than the other.  Of course, Newton’s 3rd Law will triumph and the forces will be identical.


Gravity

What goes up must come down.  This is true of course for all earth bound objects (including basketballs) due to the ever present force of gravity.  Without gravity the trajectory of a basketball player’s shot would be straight to the ceiling of the arena, where most of the fans would be viewing the game.

Exploring the accelerating force of gravity using the Motion sensor

PASCO offers several technologies and techniques for measuring gravity including the Wireless Smart Gate and Picket Fence and the new Freefall apparatus.  Both of these techniques are accurate and precise means to measure gravity.  A third technique and one more appropriate for relating to a basketball shot is to measure the position of a vertically tossed ball and then have the software derive an acceleration graph from this data.  Statistics, including the Mean of the acceleration plot can be calculated by the software for the period when the ball was in freefall as shown in the graph.


The average acceleration in the free fall period is approximately -9.5 m/s/s


Included Products:

Keyano College’s New Power Engineering Lab

Last month, Jason Peng from AYVA Educational visited Keyano College’s new Power Engineering Lab in Fort McMurray. The 4th Class Power Engineering Certification lab is designed for students who have completed 4th Class Part A & B theory courses from a recognized post-secondary institution, but do not have the six months steam time experience required to become certified as a 4th Class Power Engineer by ABSA.

Pictured above is the interior of the new power engineering lab.

Burnt Woodlands covered in snow in Fort McMurray.

SPARKvue 4.0

SPARKvue makes data collection and analysis easier than ever before with cross-platform compatibility on Chromebooks™, iOS, Android™, Windows®, and Mac®, or on our standalone datalogger, the SPARK LXi.

Why SPARKvue?

SPARKvue makes data collection, analysis, and sharing quick and easy on every platform. Compatible with all of PASCO’s wireless and PASPORT sensors, students can quickly set up their lab, or use a built-in Quick Start Lab and begin collecting data immediately. SPARKvue is for all sciences and grade levels. However, if you’re an advanced user looking for more capabilities such as video analysis, advanced statistics and calculations, and greater customization of data displays on a PC or Mac®, then check out our PASCO Capstone™ software.

Since SPARKvue was first released, it has been winning awards, and we never stop improving it. With the latest major release of SPARKvue 4, we’ve continued to add features without adding complexity. A new Welcome Screen makes it easy to get started and discover SPARKvue’s capabilities. Whether you want to add data manually, use sensors for real-time or remote logging, or open one of the hundreds of existing labs, this is your starting place.

SPARKvue Landing Page Example

Data Collection

Using a USB or an interface, with SPARKvue you can just plug-and-play with nearly one-hundred sensors via Bluetooth®, which pairs wireless sensors through a simple in-app list (no system settings are required). PASCO understands that classrooms and labs can be hectic, so SPARKvue allows you to simply select a sensor from the sorted list (the closest sensors are first) and match a 6-digit laser-etched ID number to get connected. This method works even when there are dozens of Bluetooth sensors in the same lab.

Once you’ve selected a sensor, choose from a template or QuickStart Experiment, or you can build a page to meet your needs. SPARKvue is designed for inquiry, and students are not constrained to a few pre-selected layouts… the software can support expanding capabilities with ease.

SPARKvue Connection Screen Example
SPARKvue Template Screen Example

Collecting and visualizing data is easy with an array of displays, and the tools you need for analysis are right at your fingertips. Students can annotate data, apply curve fits, compare runs, create calculations, and much more! In-context tools make it simple to find what you’re looking for, which means that students spend their time learning the science, not the software.

SPARKvue Data Screen Example
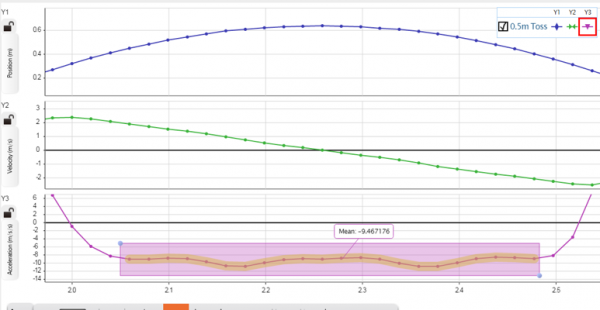
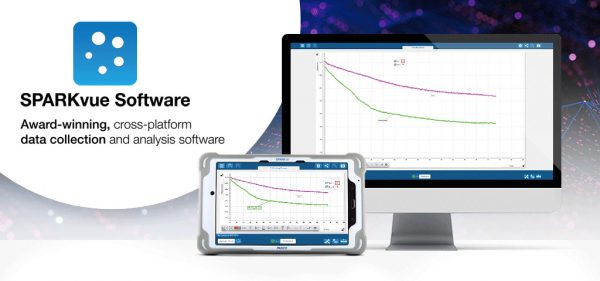
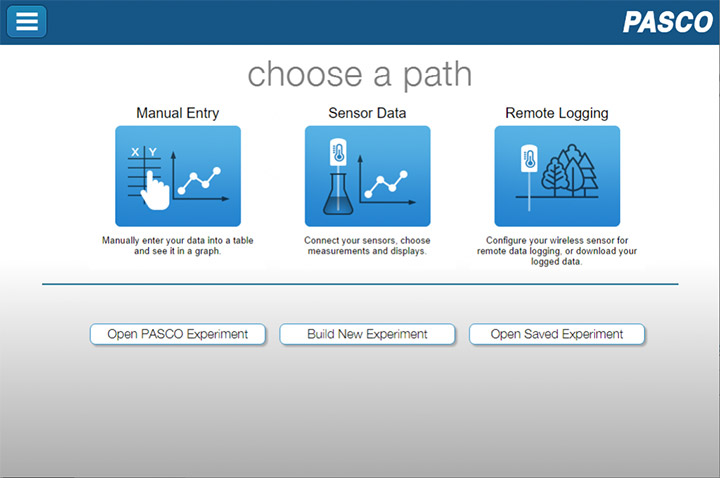
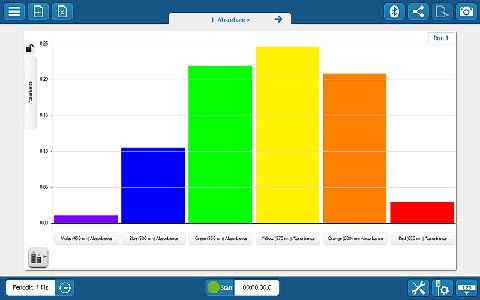
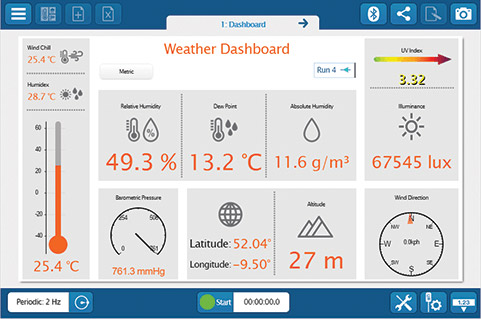
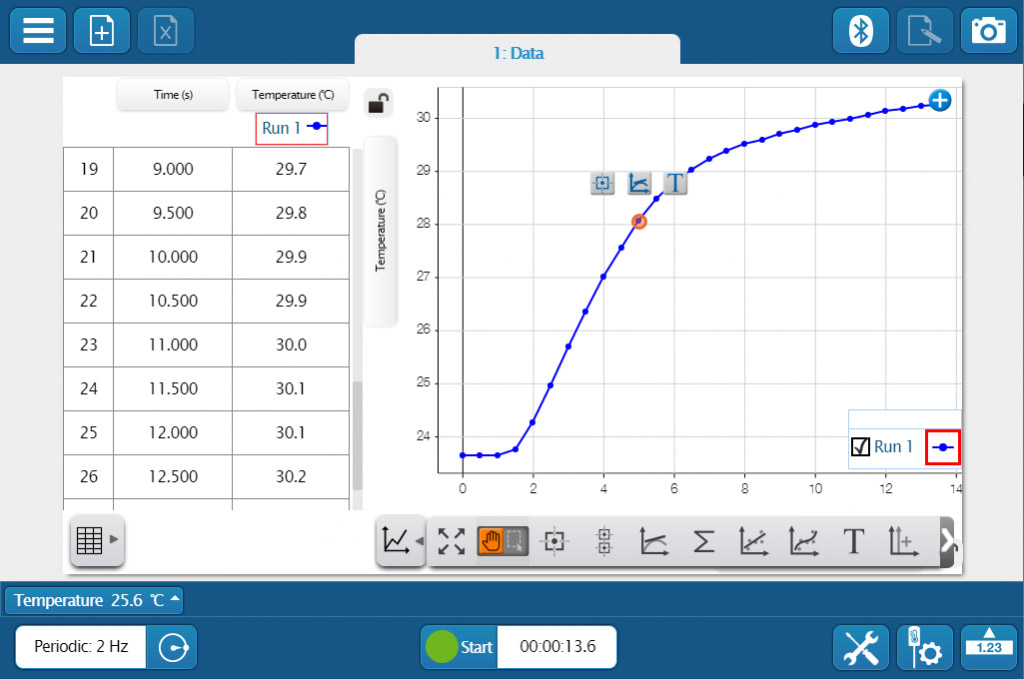
Whether you’re teaching K–8, high school, or college students, SPARKvue has the displays and tools you need to collect and analyze data. The basics you’d expect (such as digits, meter, graph, and table) are all included, but you will also find FFT, bar graphs, map display, embedded assessment questions, video playback, image capture, and analysis, as well as space for text and images. The labs you can build are only limited by your time and creativity.

Data Sharing and Export

When it’s time for students to submit their work, SPARKvue supports a variety of formats, and its export tools make it easy for educators. Students can easily snapshot their work in SPARKvue and submit an image, export the data to a .csv file to work in a spreadsheet, or save it in our .spklab format when they can come back and do more work in the future. SPARKvue also supports many other apps for saving or sharing data, including Google Drive on Chromebooks™.

SPARKvue Sharing Screen Example
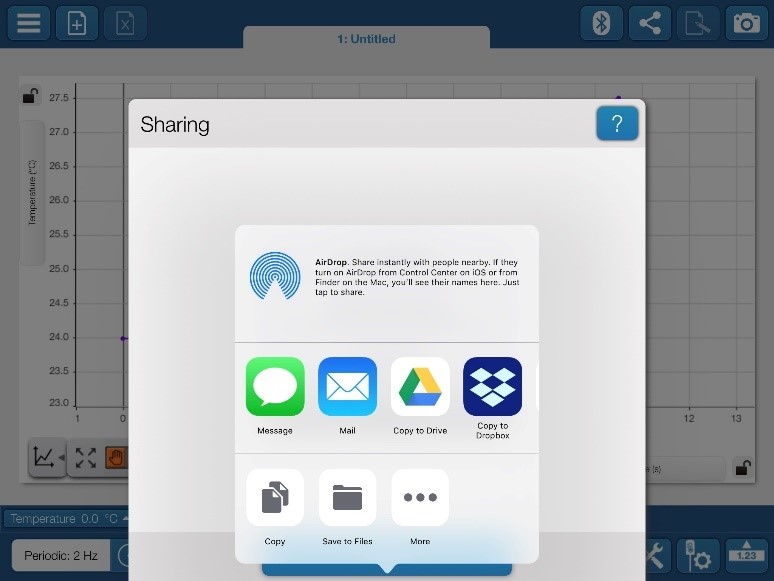
If students are collaborating on a lab activity across devices, they can set up a shared session and stream results in real-time. Then, when the session is over, each student will have a copy of the data to analyze independently. These sessions can be set up in seconds within a student group, or the entire class can share the data from a teacher demonstration.

SPARKvue Data Screen Example

Data Collection

  • Live Data Bar: See sensor readings before you start sampling.
  • Periodic sampling: Automatic sampling proceeds at a fixed rate.
  • Manual sampling: Saves data only when a user specifies.

Data Displays

  • Graph, including multiple plot areas and axes.
  • Digits
  • Meter
  • Data Tables
  • FFT
  • Map Display
  • Bar Graph
  • Weather Dashboard (when used with the Wireless Weather Sensor with GPS)

Analysis Tools

  • Scale-to-fit: Adjust axis for optimal view of the data.
  • Data Selection: Easily select a portion of the data for analysis.
  • Prediction Tool: Visualize a prediction alongside the data.
  • Smart Tool: Find data point coordinates and calculate delta values.
  • Calculations Tools for Statistics: Easily get basic statistics (min/max/mean) and more.
  • Slope Tool: Find the slope of a point.
  • Curve Fits: 10 different curve fits with goodness of fit values.
  • User Annotation: Easily add text annotations to runs or points.
  • Easily add a y-axis or a new plot area.
SPARKvue Data Collection Example

Designed for Science Learning

  • Convenient annotation, snapshot, and electronic journaling are among the features that support peer dialogue, classroom presentations, and assessment.
  • Create and export electronic student lab journals.
  • Integrated with cloud-based file-sharing services such as Google Drive, Dropbox, and more.

The Same User Experience Across:

  • Computers
  • Chromebooks™
  • Tablets
  • Smartphones
  • PASCO dataloggers

More Features

SPARKvue Graph Data Screen

Graph data from a sensor & see the results in real-time.

SPARKvue Meter Screen

A Bar Graph used to investigate absorbance.

SPARKvue Boyles Law Screen

Boyle’s Law using both manually entered & sensor data.

SPARKvue Weather Dashboard Screen

Weather dashboard to monitor atmospheric conditions.

SPARKvue Choose a Path Screen

The new entry screen makes getting started even easier. Choose from three entry paths.

Download:

Download the latest update or give it a try for free.

Windows® Computers

  • Filename: SPARKvue-4.3.0.10.exe
  • Filesize: 250.32 MB
  • Version: 4.3.0
  • Released: Dec 13th, 2019

Download Free Trial Download Update

Mac® Computers

  • Filename: SPARKvue-4.3.0.10.dmg
  • Filesize: 132.67 MB
  • Version: 4.3.0
  • Released: Dec 13th, 2019

Free Apps for iPhones, iPads, Android tablets and Chromebooks

These SPARKvue apps provide the complete software install so that the user experience is the same regardless of platform. Updates for these apps are handled via direct notification and installation on your device, including SPARK LX/LXi users.


System Requirements

Windows
  • Windows 7 SP1 or later
  • Processor: 2 GHz or greater
  • RAM: 2 GB or greater
  • Disk Space: 459 MB or greater
  • Resolution: 1024 x 768 or greater
Mac
  • Mac OS X v 10.11 or later
  • Processor: 1 GHz or greater
  • RAM: 2 GB or greater
  • Disk Space: 202 MB or greater
  • Resolution: 1024 X 768 or greater
Chromebook
  • Chrome OS v70 or later
iOS
  • iOS v9 or later. Compatible with iPhone, iPad, and iPod touch.
Android
  • Android v5.0 or later. Compatible with tablets or phones.

About The Free Trial

  • This is a fully-functional 60-day free trial of SPARKvue software for Windows or Mac Computers.
  • After the 60 day trial, a licensed version of SPARKvue will be required to continue.
  • The full version of SPARKvue is also available as a free app for iPads, Android tablets, and Chromebook devices.

The Effect of Learning Through Inquiry: A Blog Series

Who am I?

Hello World! My name is Maayan, and I am another co-op student at AYVA. I’m currently studying biochemistry at the University of Guelph, which is how I ended up on the AYVA Team. A bit more about me: I do not have any cute pets, but I do have two younger brothers. I’m interested in science, especially all the cool discoveries that can be made to improve the human condition. Outer space is rad. I can talk about Mars colonies for hours on end.

How did I get into science?

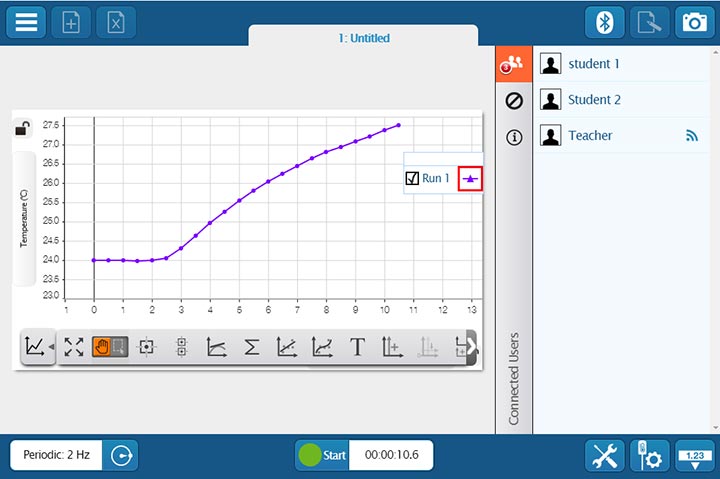
As a wonderfully sweet little child, I frequently stole my brothers’ toys. I built Lego castles, controlled toy cars, and appropriated (stole) puzzles by the box. I liked building things, and I liked breaking things down to see how they worked. As I continued to grow into an adolescent, I enjoyed reading science fiction, enough to finish all the books my school library had.

Eventually, as I skipped on through life, I was assigned to do a school project on an important Canadian. I chose Julie Payette, an astronaut (and currently the Governor-General), and my interest was born. It was amazing to me that people had gone to the moon, and now different countries were collaborating on the International Space Station for scientific research. For the first time, I felt that people could come together for a cause to further humanity. The five-dollar bill is still my favorite: it has the Canadarm2 and the astronaut on it. To this day, I smile whenever I see one.

In high school I realized that astronauts couldn’t have gotten to space without a team of people down on earth who helped solve problems, and just because their jobs were less flashy (and got less camera time) it did not mean that they were any less important. Anyway, I liked biology (humans!) and enjoyed learning chemistry (and about the universe). I couldn’t decide which one I liked better, so biochemistry is the major I chose. No one seemed to be offering xenobiology or astrobiology courses at the time, but I hope someday they will.

What’s Next?

Back to the blog, I will be writing a few articles on teaching science through inquiry. This is important for future STEM-ists since teaching STEM is only a step before understanding STEM. After all, every inventor, scientist, engineer, mathematician, technologist, and astronaut started as a student.

Nice to meet you, and I hope to write again soon,

Maayan

Explore Fundamentals of Radiography, X-ray Photography, Ionisation and Dosimetry with LEYBOLD’s Modular X-ray Apparatus

LEYBOLD’s X-RAY Apparatus impresses with its superior safety concept, and its continuously improved capabilities and features. Six different X-ray tubes (with different anode materials) are available, which is a unique feature for an educational X-RAY apparatus.

It sets new standards in resolution and intensity in the field of education worldwide. The high resolution of the Bragg spectra is impressive, as is the new high-resolution X-ray image sensor, the reliable X-ray energy detector and the gold tube.
The modular structure of the system enables both a low-cost introduction and advanced applications for several different test subjects.
SHARE YOUR CART