Within the faculty of Engineering and Applied Sciences, Laboratory Instructor Dean Milton runs a Fluid Mechanics laboratory, with lab sessions for students studying degree courses in Environmental Engineering, Industrial Engineering and Petroleum Engineering.
Over the years, they have purchased five generations of TecQuipment’s Hydraulic Bench and associated experiments. Their first generation Hydraulic Bench introduced in the late 1960s is still in fully functional order.
Milton captured why they choose TecQuipment’s products, “Repeatability when it comes to running experiments to prove theory, is the number one reason we stick with these products. I know that my students are going to get good, consistent reliable results. I also know they are going to last. The fact that equipment the University bought over half a century ago is still working says it all. This isn’t just because they are designed and built really well, it’s also down to these products being really good to maintain.”
Equipment that lasts a working lifetime
The five year warranty offered with TecQuipment products tells only part of the story. Detailed manuals that cover maintenance, as well as teaching guidelines, theory and workbooks for students, give academics the details required to perform routine maintenance. The support provided by local sales agents and the TecQuipment Customer Service’s team at TecQuipment’s headquarters, ensure problems get solved no matter how long the product has been in service.
Agents around the world
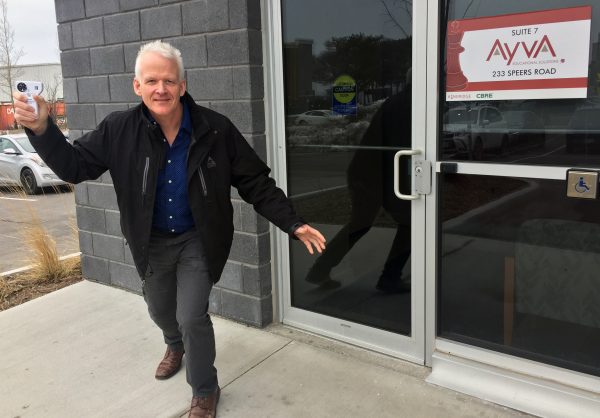
Milton talked highly of the local TecQuipment agent in Canada, AYVA Educational Solutions:
“The AVYA experience is great! Their post-sale technical support is unparalleled.”
TecQuipment works with 60 plus agents around the world, supported by a strong team of export personnel based in the UK HQ.
Modular products make incremental investment easy and decrease lab set-up time
Many products within the Fluid Mechanics range from TecQuipment are modular. Not only does this mean that investments can be done incrementally, but it also makes lab set-up time quicker and easier.
Milton commented: “I’m often running two lab sessions at one time in two different rooms. Being able to use the base module like the Hydraulic Bench and quickly be able to switch out the experimental modules makes running a tight schedule of laboratory sessions possible. With a few of my own modifications like adding quick connects and valves I can make this changeover even slicker.”
The University of Regina recently purchased eight of the newest Digital Hydraulic Benches from TecQuipment. While many of their older benches were still in good functioning order, the decision was made to update to the latest model with digital flow and capacity measurement capabilities, which ultimately means that experiments can be performed much more quickly. The older units have been donated to a local college. With the Hydraulic Benches the University uses the following experiments:
- Impact of a Jet
- Friction Loss in a Pipe
- Discharge Over a Notch
- Flow Measurement Methods and the Bernoulli’s Theorem.
Upgrades to increase the product’s lifetime
As new product upgrades have been made available, the University of Regina has been quick to seize these opportunities to extend the life of their products. Their Losses in Piping Experiment purchased in the 1990s was recently upgraded with an electronic pressure measurement system. This has improved the accuracy of the experiment results and eliminated the use of mercury in the apparatus.
Engineering understanding for local environmental challenges
Milton was explaining how in Canada the region experiences many challenges with infiltration of water into the basements of buildings. In response to this, the University purchased the Hydrology and Rainfall Apparatus that simulates rain and moving storms over a permeable medium. It also demonstrates hydrology phenomenon such as erosion caused by water flow and watersheds for simulated islands with rainfall and well flows.
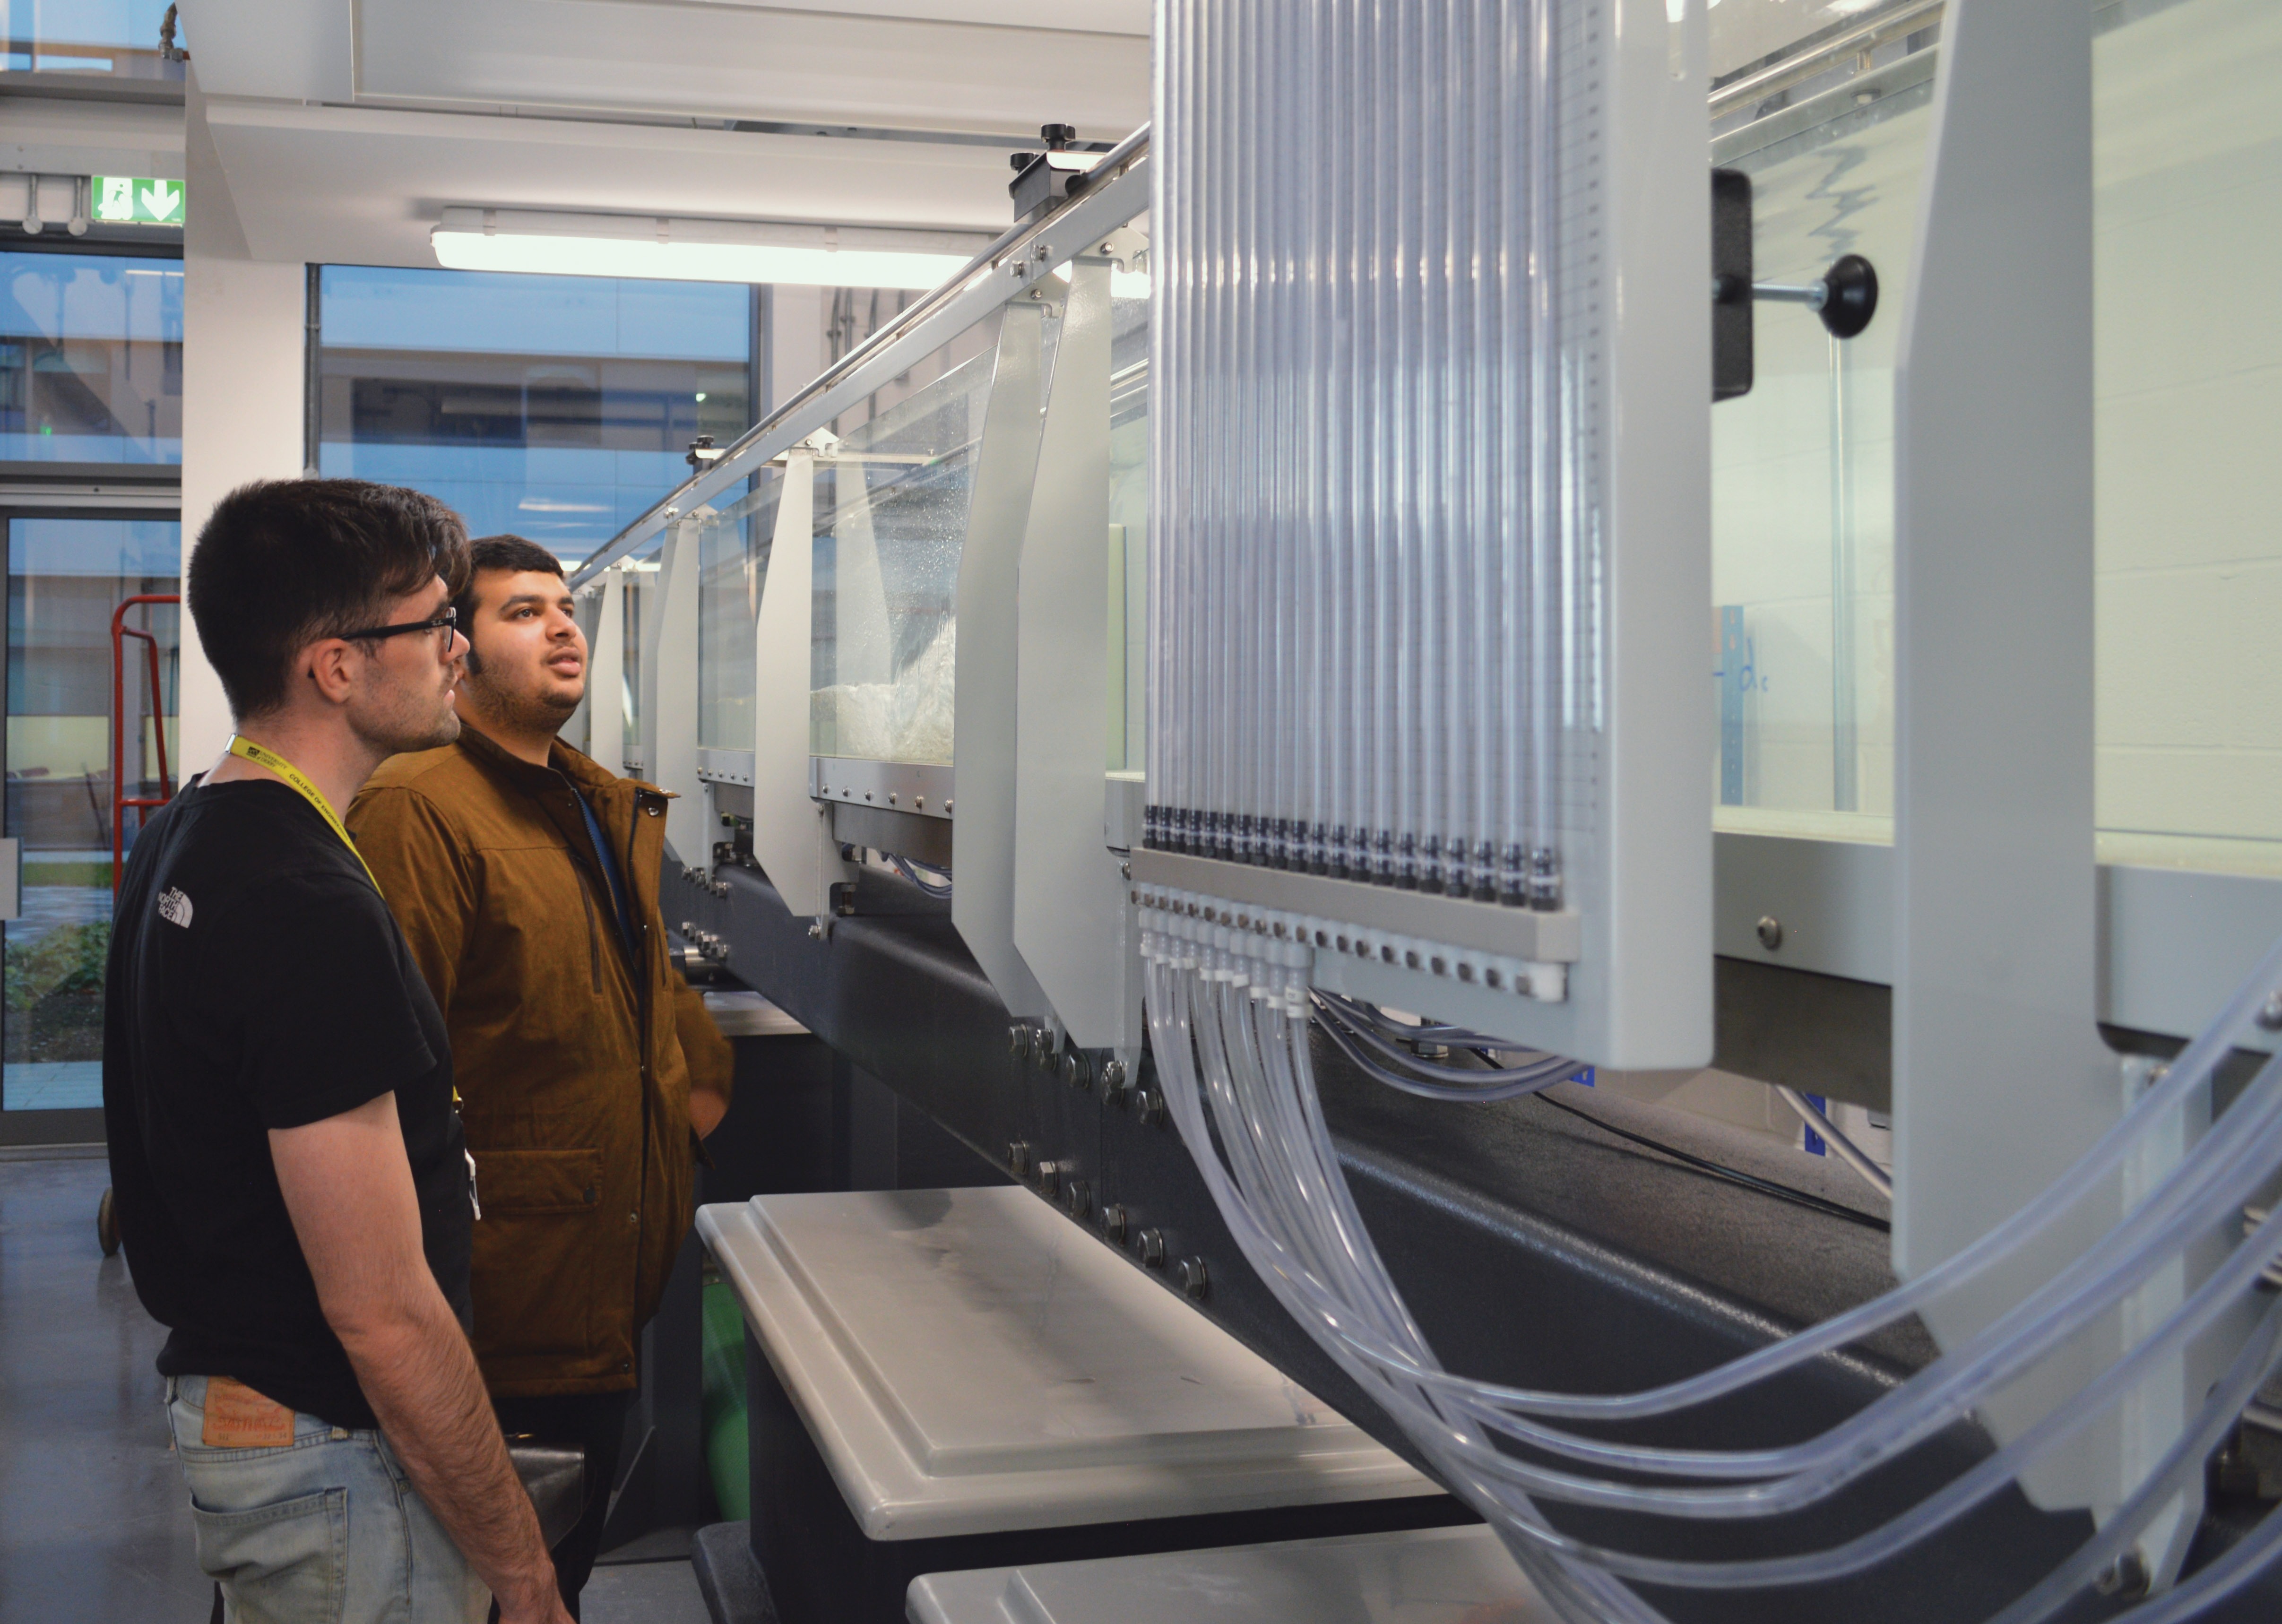
Factory visit
TecQuipment encourages people from around the world to visit their factory in Nottingham, UK where the equipment is designed and manufactured all under one roof.
Milton noted that “After visiting the factory and having a meet and greet with the key players I was left with a great confidence in dealing with the people of TecQuipment. I know I can call and speak to people about any problems I might have with the equipment.”
During his visit, Dean Milton demonstrated the Digital Hydraulic Bench. Watch the video below.