An Experiment Across Canada: How to Connect With Students Through Online Learning
Do you remember when in class teaching was considered standard, and a 6-feet social distance rule was not in place? A time before Zoom lectures were the new normal, and hands-on learning was encouraged in the classroom? With socially distant, hybrid, or virtual learning becoming a routine for teachers and students, it’s important that we find ways to incorporate student engagement in STEM courses.
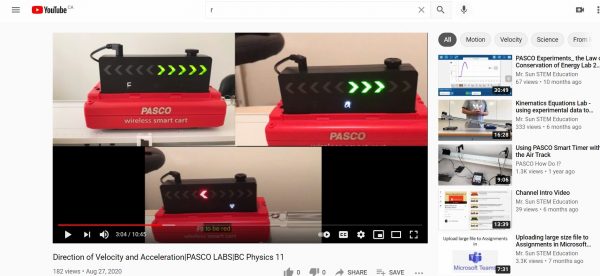
I am a second year Environmental Sciences student at the University of Guelph currently in the Co-operative Education stream. I had the great opportunity to work for AYVA Educational Solutions for my first work term. As 2021 continued, I began to wonder, what would the effects of Covid-19 be on student involvement in STEM education? It was at this time, that I paired up with Ross Sun, a high-school teacher in the province of British Columbia. Ross is a great believer of hands-on learning techniques being accessible to students, even from remote settings. He has a YouTube page called ‘Mr. Sun STEM Education’ that focuses on providing virtual material for his students, with many of his videos including PASCO equipment such as the Smart Cart Dynamics System.
“Hands on learning in the modern society (especially right now) not only refers to making things by hands but also using technology. In fact, during this pandemic time when we try to limit traditional hands on activity/lab, using technology becomes the #1 alternative […] And that includes but not limited to virtual labs, video analysis, programming, making videos, and the use of sensors which can output data to be shared such as PASCO sensors.” – Ross Sun
In order to investigate ways that teachers and students can interact virtually, while still maintaining high levels of curiosity and investigation in the classroom, the two of us were able to conduct a three-day long experiment using PASCO wireless weather sensors.
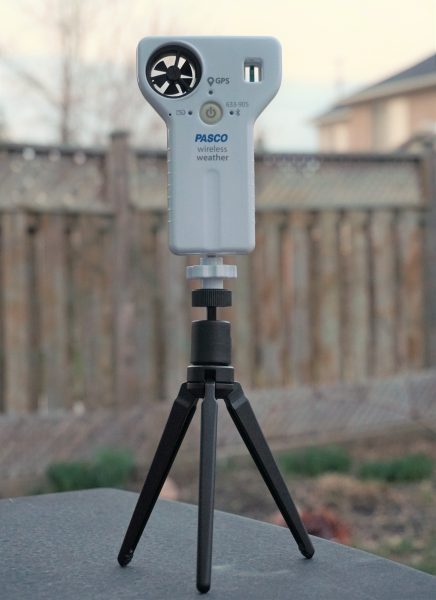
The weather sensor is an all-in-one device for monitoring environmental conditions and has the ability to measure over 17 different factors simultaneously, including temperature, humidity, light, and pressure. Being an environmental student, this sensor was perfect for the type of experiment we were hoping to conduct. The two of us were able to create a project that would analyze and compare the weather in Ontario and British Columbia. Over the course of 72 hours, starting on March 30th and going until April 1st, two weather sensors tracked and calculated the temperature and relative humidity in both locations. The free SPARKvue app available to mobile devices was able to connect with the sensor to begin logging. PASCO’s remote logging option was a great feature to use because once the sensor was connected, you could take your phone anywhere without it disrupting the sensor from recording data. This made the experiment extremely easy to complete without constantly monitoring the device.
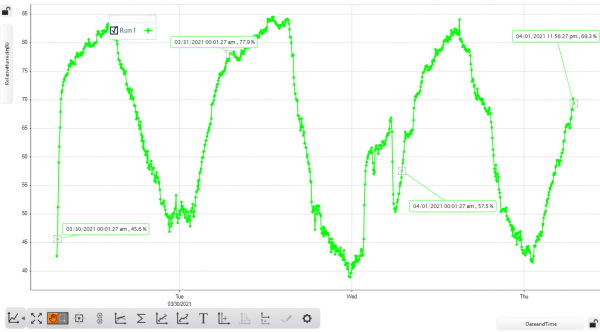
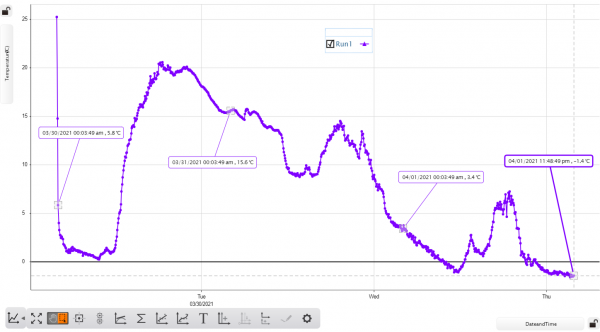
Both sets of data were then downloaded to the SPARKvue desktop software where weather trends were compiled into graphs. The mentioned graphs can be seen below where it is very noticeable that the particular region in British Columbia, where this investigation was conducted, contains stable waves of increasing and decreasing temperature and relative humidity. In contrast to this, the temperature and relative humidity recorded for Southern Ontario is much more sporadic with a less consistent pattern.
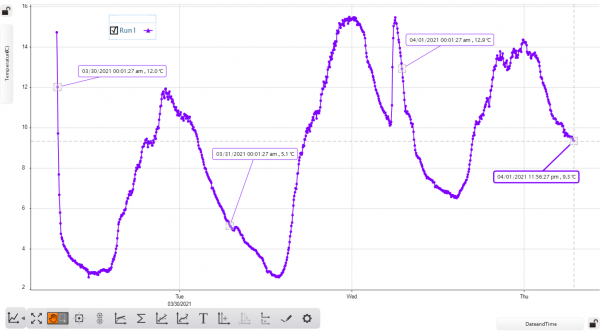
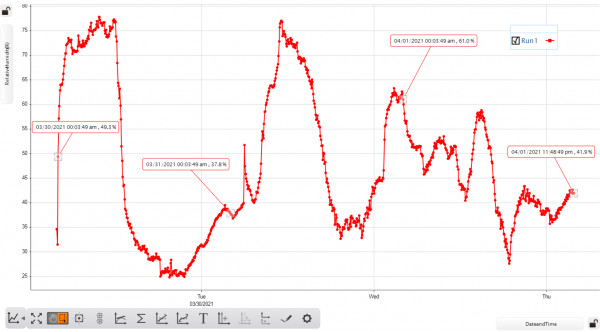
The graphs above show the recorded data sets for relative humidity (right) and temperature (left) for the east coast of British Columbia. The trend shows large changes in temperature of the 72 hour period with consistent waves being formed. The first recorded data set for each day is represented by a connecting box with the date and time.
The graph above shows the recorded data sets for relative humidity (right) and temperature (left) in Southern Ontario. In contrast to the data recorded for BC, there is no clear pattern of increases and decreases in temperature and relative humidity. The temperature is on an overall trend downward with sudden small changes throughout the days. The relative humidity shows several irregularities and spikes throughout Thursday. The first recorded data set for each day is represented by a connecting box with the date and time.
This experiment is an example of how easy it is to combine inquiry-based and hands on learning with remote teaching practices. Using the SPARKvue Shared Sessions, teachers and students can collaborate online with real-time data, where each student has the ability to manipulate and examine the data collected.
Exploration and curiosity is one of the most important elements for students advancing through the secondary school level. This crucial time is when many students consider their professional careers beyond high school, and make informed decisions on the type of post-secondary path they want to follow. The PASCO wireless sensors are an excellent option for providing students with the freedom to explore backgrounds in STEM, even from the safety of their own homes.
Resources: