Description
Go beyond tracking weather
Analyze trends to create understanding
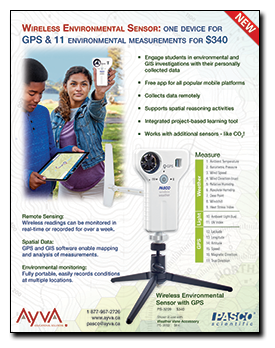
The Wireless Weather Sensor with GPS is an all-in-one instrument for monitoring environmental conditions. A built-in anemometer as well as sensing elements for temperature, humidity, pressure, light, and GPS the sensor provides up to 19 different measurements that can be used individually or simultaneously.
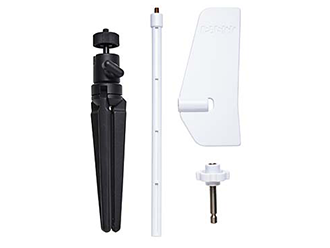
Use the sensor in logging mode with the optional Weather Vane Accessory for long-term monitoring, or use it as a hand-held instrument to study microclimates and record ambient conditions relevant to many biological and environmental phenomena.
Conduct GIS/mapping experiments using the onboard GPS sensor in conjunction with any of the other available measurements. The new map display in PASCO software provides a way for students to analyze spatial data.
Best of all, even with the versatility and functionality available, the Wireless Weather Sensor with GPS is simple and intuitive for students to use.
Note: The anemometer can only be used in winds at or below the max speed rating. Using it in hurricane-level winds or with a leaf blower can damage the unit.
SPARKvue is now compatible with ArcGIS, allowing for GPS data analysis and visualization. Students can also export their data and load it into a map at ArcGIS.com.
Measurements
Weather Measurements
- Ambient Temperature
- Barometric Pressure
- Wind Speed
- Wind Direction (true)
- Relative Humidity
- Absolute Humidity
- Dew Point
- Wind Chill
- Heat Stress Index
Light Measurements
- Ambient Light (lux)
- UV Index
- PAR
- Irradiance
GPS Measurements
- Latitude
- Longitude
- Altitude
- Speed
- Magnetic Direction
- True Direction
Applications
- Conduct weather sensor experiments by collecting multiple days of weather data
- Study wind and pressure changes as a storm or front approaches
- GIS and mapping activities to investigate water quality, species distributions, and more (when used with other sensors)
- Investigate microclimates
Features
- Logging mode for long-term experiments
- Water-resistant for extended environmental monitoring
- Built-in light sensor for measuring light level and UV index
- Special map display (in SPARKvue software) for analyzing spatial data
- 19 different measurements that can be collected and analyzed individually or simultaneously.
What’s Included
Specifications
| Barometric Pressure |
|
| Ambient Temperature |
|
| Wind Speed |
|
| Directional measurement |
|
| Relative Humidity |
|
| Illuminance (light level) |
|
| UV Index |
|
| Altitude (via GPS) |
|
| Speed (via GPS) |
|
| Connectivity |
|
| Battery |
|
| Data Logging |
|
| Water-resistance |
|
| Operating Environment |
|
| Calculated measurements |
|
| GPS |
|
Battery & Logging
| Stored Data Points Memory (Logging) 1 | >35,000 |
| Battery – Connected (Data Collection Mode) 2 | >44 hr |
| Battery – Logging (Data Logging Mode) 3 | 1.5 days (with GPS), 11 days (w/o GPS) |
| Battery Type | Rechargeable LiPo |
1 Minimum # of data points with all measurements enabled, actual results depend on enabled measurements.
2 Continuous use in a connected state until battery failure, actual results will depend on sample rate, active measurements, and battery condition.
3 Logging until battery failure, actual results will depend on sample rate, active measurements, and battery condition.
* Normal classroom use is the sensor in active use for 20min/lab for 120 lab periods/yr.
Experiment Library
Perform the following experiments and more with the Wireless Weather Sensor with GPS.
Visit PASCO’s Experiment Library to view more activities.
- Transpiration
- Monitoring Microclimates
- Modeling an Ecosystem
- Monitoring Water Quality
- Tracking Weather
- Weather in a Terrarium
- Percent Oxygen in Air
Recommended Accessories
| Weather Vane Accessory | PS-3553 | |
| Wireless Weather Sensor Storage Tray | PS-3596 | |
| Wireless Sensor Charging Station | PS-3599 |
Replacement Parts
| Micro USB Cable | PS-3584 |
Also Available
| USB Bluetooth Adapter | PS-3500 |