English Français
Search
Generic filters

1-877-967-2726

Wireless Sensors are Now Stocked in Oakville!

Here are just a few of the products currently available! If you need something quickly, please give us a call @ 877-967-2726. We can ship across Canada for delivery within a few days for all Canadian stocked items.

Also in-stock & on sale!!

Many of PASCO’s wireless sensors are now stocked in Oakville, Ontario.

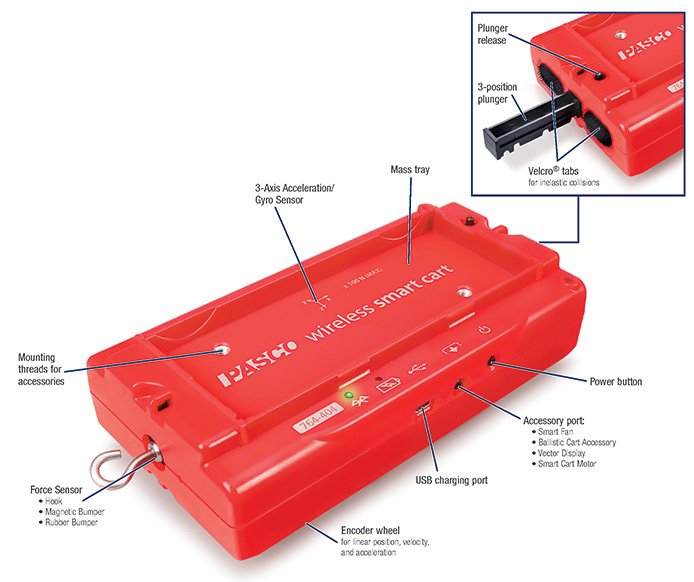
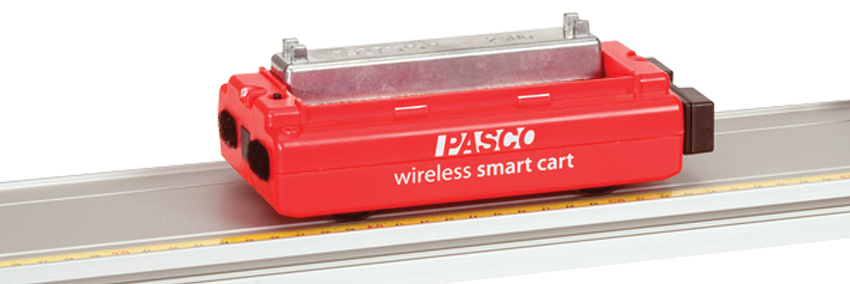
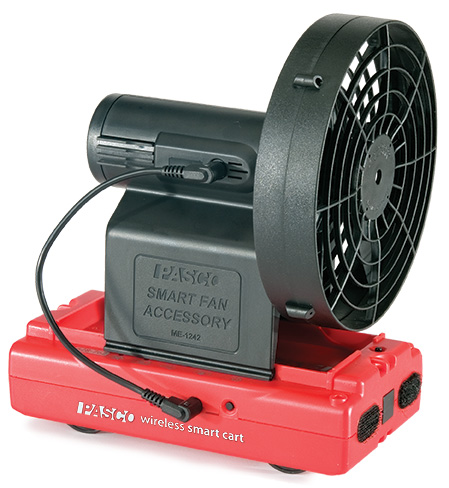
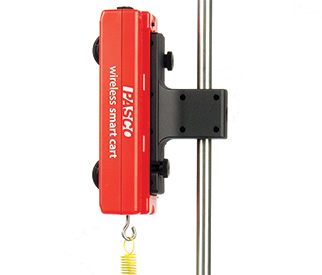
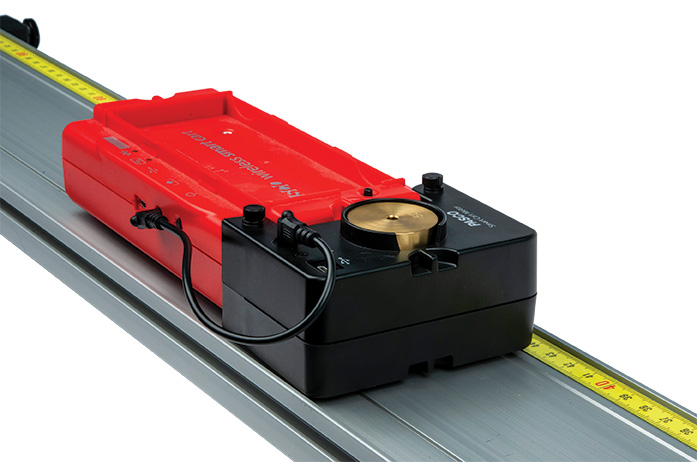
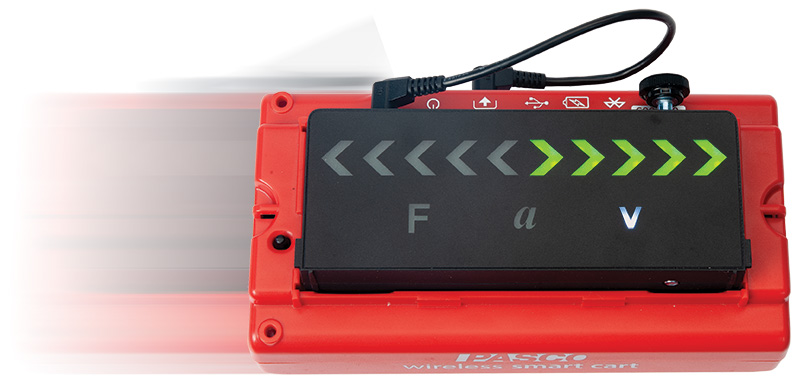
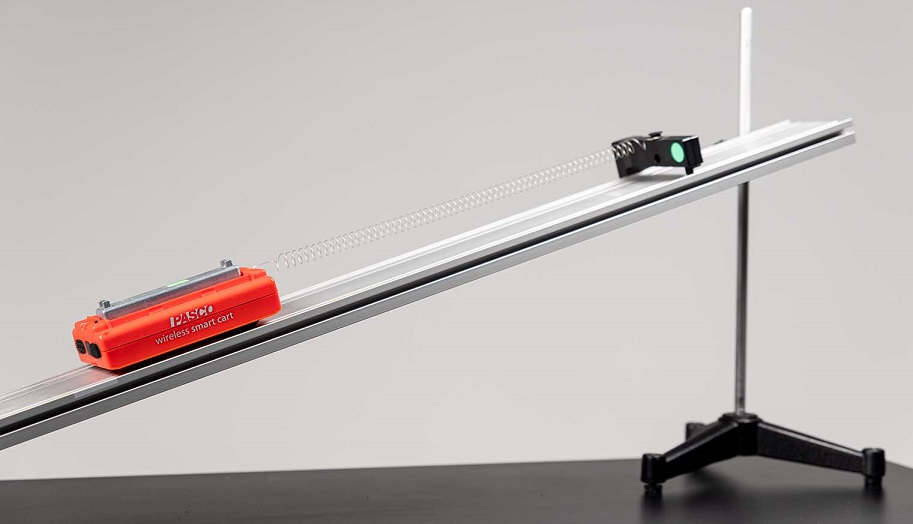
Smart Carts
Red: ME-1240
Blue: ME-1241

Wireless pH Sensor
PS-3204

Wireless Light Sensor
PS-3213

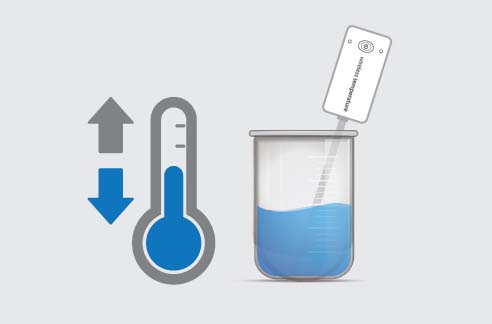
Wireless Temperature Sensor
PS-3201

Wireless Sound Sensor
PS-3227

Wireless EKG Sensor
PS-3236

Wireless Spirometer
PS-3234

Wireless Force Sensor
PS-3202

Wireless Soil Moisture Sensor
PS-3228

Airlink
PS-3200

Wireless Acceleration Sensor
PS-3223

Wireless Colorimeter
PS-3215

Wireless Pressure Sensor
PS-3203

Wireless Rotary Motion Sensor
PS-3220

Wireless Temperature Link
PS-3222

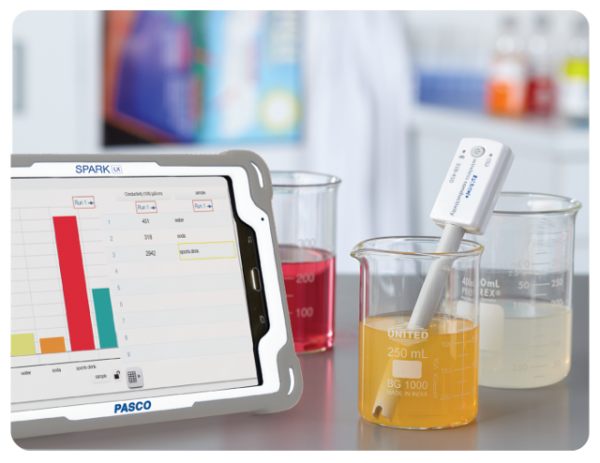
Wireless Conductivity Sensor
PS-3210


Physics in Soccer: World Cup 2022

The 2022 World Cup has officially begun, and there’s never been a better time to explore the physics of soccer (or in Europe, football) with your students! From predicting the outcome of a crossbar challenge to understanding the science behind Ronaldo’s famous knuckleball free kick, physics plays an important role in determining which team rules the pitch.

Throughout the World Cup, we’ll be sharing soccer-themed content to help you bring the excitement of the World Cup into your physics course. In our first segment, we’ll explore the physics of soccer’s most infamous pre-match event: the crossbar challenge.

The Physics of Soccer: Crossbar Challenge

The crossbar challenge is a popular pre-game competition held between players from opposing teams. To compete, players take turns kicking soccer balls into the crossbar of a goal. The player who hits the crossbar the most wins the crossbar challenge. Seems simple enough, right? Well, not exactly!

In reality, the crossbar challenge is, well, challenging. The average player is lucky to land two of their five shots, which makes the five-for-five performances of superstars like Neymar Jr. all the more impressive. In fact, Neymar’s success in crossbar challenges is so repeatable that it begs the question: what is Neymar doing that other soccer players aren’t? (Check out this video to see Neymar demonstrate his technique in a crossbar challenge against two other professional soccer players.)

As it turns out, there is a secret to Neymar’s success: physics! When a player kicks a soccer ball, its landing position is largely determined by both the aerodynamics of the ball and the angle, direction, and velocity of the player’s kick. If we ignore aerodynamics for a moment (more on that later), then the crossbar challenge becomes a real-world example of projectile motion.

Incorporate the World Cup into your physics course with these soccer-themed projectile motion problems! Download the student worksheet for free below.

Celebrate the World Cup with these Soccer-Themed Practice Problems!

Download the free Physics in Soccer student handout and answer key below.


1. While warming up for a match at the World Cup, Neymar challenges Aleksandar Mitrović to a crossbar challenge. Both players must take their shot 11 meters away from the goal, but the angle and speed of their kicks can vary. The crossbar is 2.4 meters above the ground. Assuming air resistance is negligible, answer the following questions:

a. If Neymar kicks the ball at a 40° angle, and it takes .87 seconds to hit the crossbar, what must the initial speed of the ball be?

b. Mitrović launches the ball at a 41° angle with a velocity of 18.4 m/s. It flies through the air, passing 1 meter above the crossbar. How long is the ball in the air?

c. Challenge Question: The next round, Mitrović kicks the ball with an initial velocity of 21.0 m/s. Determine the minimum and maximum kicking angles required for the ball to make contact with the crossbar.


2. During a World Cup match, Lionel Messi kicks the ball at a 45° angle from ground level. It reaches a maximum height of 3.2 meters and lands 22.7 meters down the pitch. Assuming air resistance is negligible, answer the following questions:

a. What is the initial vertical velocity of the ball?

b. How long does it take for the soccer ball to reach the ground?

c. What is the initial horizontal velocity of the ball?


3. When the soccer ball leaves the field during a match, a corner kick is performed to restart the game. To perform a successful corner kick, the player must kick the ball at just the right angle, so that it bypasses opponents and lands near teammates. During a practice session for the World Cup, Cristiano Ronaldo makes a corner kick at a 42° angle, launching the soccer ball with an initial velocity of 26 m/s. Assuming the ball travels with projectile motion and air resistance is negligible, answer the following questions:

a. At what time does the soccer ball reach its peak height?
b. What is the maximum height reached by the soccer ball?


4. While practicing for the World Cup, Kylian Mbappé kicks the ball from the ground at a 41° angle. As the ball launches with an initial speed of 28.5 m/s, an opponent 54 meters away at the opposite side of the soccer field begins running to get the ball. What is the average speed he must maintain in order to make contact with the ball just before it hits the ground?


File Attachments

Physics in Soccer: Projectile Motion Problems – Student V File Size: 81.32 KB
Physics in Soccer: Projectile Motion Problems – Editable File Size: 37.64 KB
Physics in Soccer: Projectile Motion Problems – Answer Key File Size: 55.11 KB

Working with TecQuipment’s Wind Turbine Dynamics Apparatus

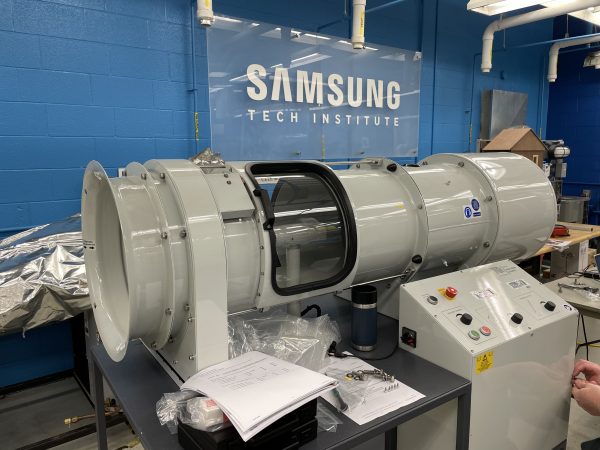
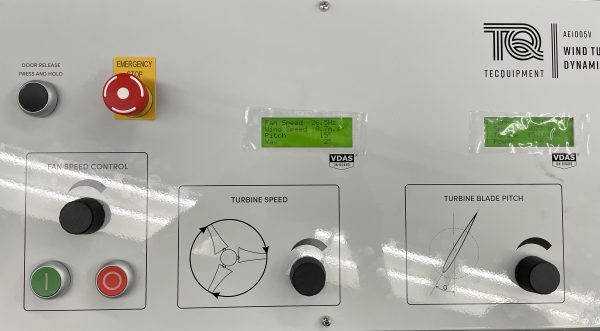
Last Friday, I was given the opportunity to take a trip to Centennial College alongside a colleague of mine to help a group of professors with the assembly of the TecQuipment AE1005V Wind Turbine Dynamics Apparatus. The apparatus is comprised of a bell shaped mouth and honeycomb to reduce turbulent airflow, a silencer to reduce excessive noise, an anemometer to record wind speed, and a digital display for pitch, yaw, fan speed, and turbine speed, all of which are adjustable. We arrived at the campus early in the morning, where we met with our contact at the school. He led us through the college into the machine shop and we began to assemble the AE1005V.

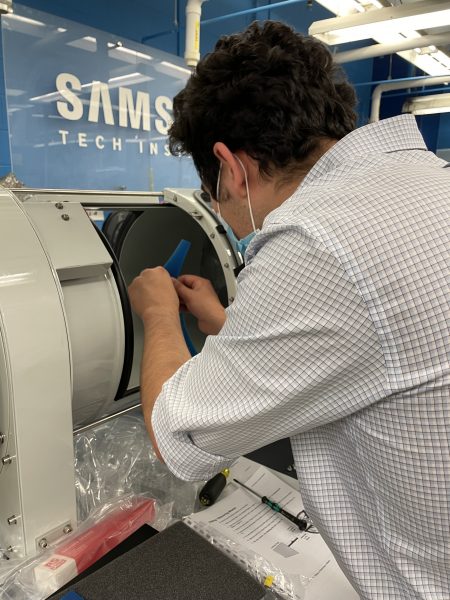
The assembly process was very simple and easy to follow from the provided instructions. Once the silencer is removed from its stowed position and fastened to the back of the apparatus, we connected the Control Cabinet to a power supply and opened the sliding door to attach the fins to the turbine. We then connected the apparatus to a laptop which was running the Versatile Data Acquisition System, or VDAS, which automatically collects data, calculates experiment parameters, and allows the user to create graphs and tables for the collected data. Once the fins were secured and the security door was closed and locked, we began to experiment with the fan speed, pitch, turbine speed, and anemometer. This data was also digitally displayed on the Control Cabinet.

Now that the apparatus was fully set up, we began to work through the first experiment to determine the influence of pitch angles and turbine speed on the coefficient of performance and power generated. As a future environmental engineer hoping to specialize in air hydrology, I was really grateful to be able to have a hands on experience with this kind of equipment. The option to switch out the included turbine fins for ones that have been 3D printed by students made the AE1005V even more interesting to use, with students being able to create and test different fin designs to determine optimal performance, and this really piqued my interest.

Eventually, I would like to spend more time using and learning about the AE1005V Wind Turbine Dynamics Apparatus, and other technology like it, and I am grateful that I had the opportunity to speak with the professors about what they plan to use theirs for throughout the upcoming fall semester.

PASCO’s Python Library

The PASCO Python Library lets learners, educators, and hobbyists take full control of their PASCO Wireless Sensors using Python code. Visit us on GitHub to download the PASCO Python API, browse sample code, and review tips for getting started.

Why Python?

  • Python is used in schools and universities around the world.
  • It’s simple, readable, and flexible, making it ideal for both beginners and experts.
  • Python resources are readily accessible thanks to its global community of creators, collaborators, and problem-solvers.

Python vs. Blockly

Blockly is an easy-to-use, block-based programming platform available in both SPARKvue and PASCO Capstone. Unlike Blockly, Python is a text-based programming language that is independent from PASCO software. This library lets you bring Python into the PASCO ecosystem for complete control of your data. With Python, users control all aspects of sensor data collection, from sensor connections and sampling rates to data displays and custom analytics.

Visit us on GitHub to view instructions for getting started and browse sample code for Python projects.

Compatible Sensors

  • //code.Node
  • Smart Cart
  • Wireless Acceleration Altimter
  • Wireless CO2
  • Wireless Conductivity
  • Wireless Current
  • Wireless Diffraction
  • Wireless Drop Counter
  • Wireless Force Acceleration
  • Wireless Light
  • Wireless Load Cell
  • Wireless Magnetic Field
  • Wireless Motion
  • Wireless O2
  • Wireless Optical Dissolved Oxygen
  • Wireless pH
  • Wireless Pressure
  • Wireless Rotary Motion
  • Wireless Temperature
  • Wireless Voltage
  • Wireless Weather

System Requirements

  • Operating Systems: Windows, Mac, Linux (Raspberry Pi)
  • Bluetooth 4.0+
  • Python version 3.7-3.10
  • IDE of your choice (VSCode, PyCharm, etc)

Example Projects

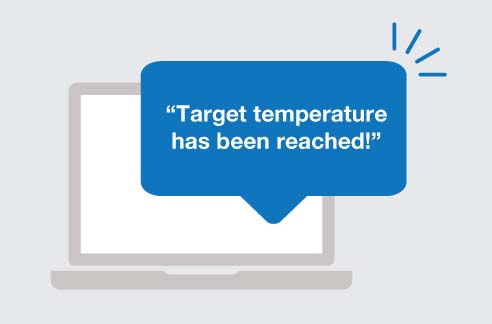
Temperature Alarm

Use a Python text to voice plugin to narrate temperatures out loud.

View Code on GitHub


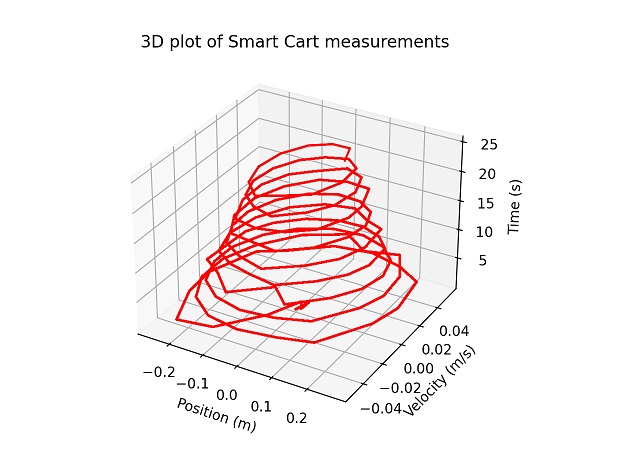
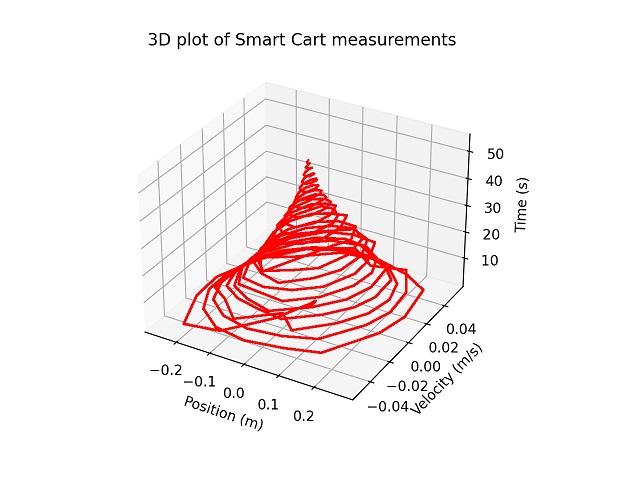
Smart Cart 3D Plot

Create an 3D plot using values from the Smart Cart.

The Beauty of Periodic Motion: A Capstone Observation Experiment

As a third-year Biomedical Engineering student at the University of Guelph, learning throughout this pandemic has been especially difficult, but why? It’s all the same materials. The same teaching style. I can even choose my learning environment and mitigate distractions.

For me, the biggest thing that has been missing throughout this pandemic has been experimentation, but more specifically, labs that push students to apply their knowledge to their own observations or to the world around them. During this pandemic, I took a course called Biomechanics as an extracurricular. Without a doubt in my mind, this course ignited my passion for practical application. Students were required to observe, collect, and write three different labs, all centered around the biomechanics of crutch walking. After learning to use a goniometer, force plate, EMG sensors, and 3D modelling software, students then created their own biomechanics experiment.

This is where the real learning begins.

What does this have anything to do with harmonics or even Capstone, you may ask? The point I am trying to make is that you can throw complicated laws and theorems a student’s way. However, they won’t understand it until they begin to connect these laws to the world around them. Every student has asked, “When will I ever use this?” but rarely do you ever find a student who seeks the question “How does this affect the world around me?” As such, I wanted to pose a simple question that pushes students to connect their knowledge outside the classroom.

What are some examples of harmonic motion in your daily life?

This question is really nothing special, but it can be easily observed and analyzed with little to no equipment. For this example, I used PASCO’s Capstone Software going frame by frame to analyze the motion of various objects and graphing the vertical position (meters) versus time (seconds).

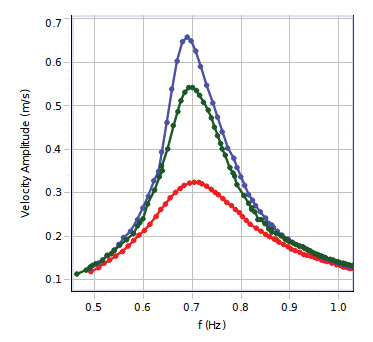
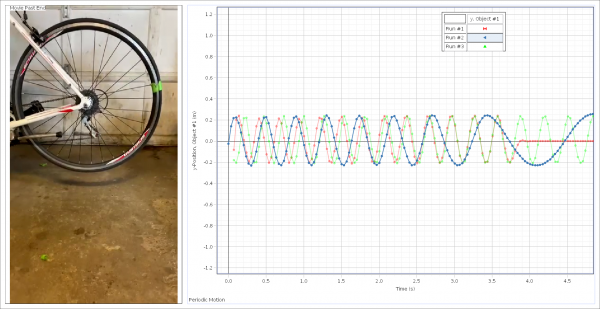
The first example of harmonic motion was the spinning of a bicycle wheel, which was suspended to have no contact with other objects. Three different examples of periodic rotation were observed using the Capstone software and a bright green piece of tape.

The green line represents a graph that has no brakes applied, the blue line represents a system with light braking pressure, and the red line represents a system with full braking.

From the data collected, it was observed that as the brake pressure is increased, the period of the oscillator decreased. This trend is essential for students to understand as it raises the question of braking distance and the effects of friction on a periodic oscillator.
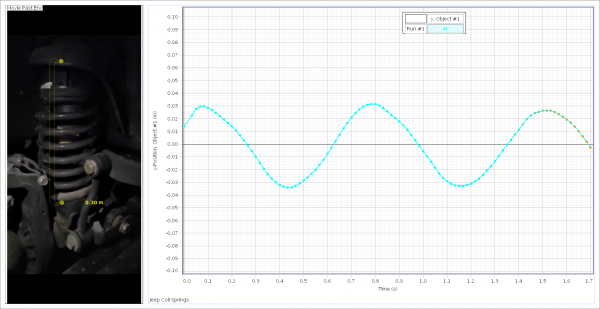
The next example of harmonic motion was car suspension. The system represents a driven harmonic oscillator as most car suspensions will be critically damped or have some sort of dampening. For this experiment, I highly recommend filming the oscillation in real-time with an additional light source. The top of the spring was tracked throughout the cycle and plotted on a vertical position vs. time graph.

The blue line represents the effect of the applied force on the vertical position (meters) of the spring vs. time (seconds).

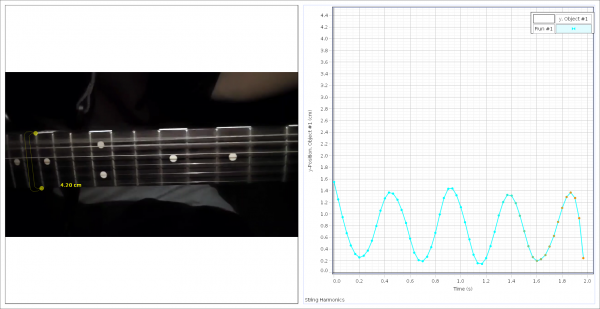
As a final example of harmonic motion, the E-String of a guitar was filmed using the slow-motion setting on a phone, shooting at about 960 fps. String harmonics are incredibly difficult to capture, and for a more accurate measurement, I highly recommend the use of a slow-motion camera. As an alternate example of harmonic motion, I recommend a swing, metronome, or any pendulum clock.

This graph represents the vertical position (centimeters) of the guitar string vs. time (s).

Laboratory experimentation is usually very equipment-heavy, which prevents students from observing the effects of the laws and theorems on a day-to-day basis. The difficulty of tracking time, position, or other factors removes focus from the real learning and can often times impede a student’s understanding. The best way to foster a student’s understanding is through their own curiosity.

Increase Student Engagement with Virtual SPARKvue Labs

One of the hardest things about teaching online during this pandemic has been ensuring student engagement.  When my physics class moved online, I knew I wanted to somehow continue the lab component but wasn’t quite sure how… until I learned about shared sessions in SPARKvue.

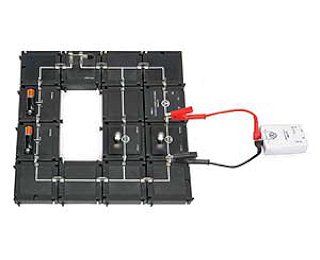
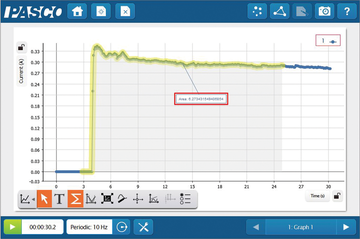
Without a doubt, remote labs were not going to be as hands-on as they were in person, but students should still have the opportunity to engage in the other practical applications of labs like making observations and analyzing data.  A shared session in SPARKvue allows students to see data being collected in real time as if they were doing experiments themselves.  I recently used this feature for a circuit lab in my Physics class.

EM-3535 - Modular Circuits Basic

I set up a circuit using the modular circuits and pointed a webcam on it so the students could see the circuit I was building and manipulating.  I then started a shared session on SPARKvue and the students all joined in to see the voltage and current readings.  As I made changes to the circuits, I had students write various predictions in the chat of our meeting room.  The ability to predict and then see what actually happens in real time reflects what my students would do if they were engaging with this lab in person.

Doing this lab remotely not only allowed the students to predict, observe, and analyze; it actually opened up an avenue for more enriched discussions due to it’s collaborative nature and engaging the entire class at the same time.  When the data didn’t exactly match a prediction, I could point to aspects of the circuit through the webcam and connect what we were seeing to the data being shown.

The ability to predict, observe, and analyze is one of the key features of any science lab. By pairing a data collection program like SPARKvue with a webcam and the modular circuits kit (or other PASCO sensors), students can observe how data is being collected and engage in the process of scientific exploration of the concepts they would otherwise only see written on a page.  SPARKvue is changing not only the physical classroom but also the virtual classroom into a more engaging, thought-provoking, and dynamic environment for learning.

Resource

How to start a shared session in SPARKvue:

SPARKvue includes an easy & effective tool for hosting distance & hybrid labs!

Alternate text

With Shared Sessions, students can easily join a SPARKvue session hosted by their teacher – or even another student – from anywhere! They observe data collection in real time and keep a copy of the data to perform their own analysis.

Setting up a session is quick and easy and allows students to participate in a home lab using just their smartphone. Once the session is finished and students have completed their analysis, they can digitally submit their work using cloud services or the Journal Snapshot tool.

Mole Day

It’s that time of year again. Chemistry teachers everywhere are dusting of their pun-ny jokes and creating mole-themed, activities and treats to celebrate National Mole Day in commemoration of Avogadro’s number (6.02 x 10²³). Mole Day is celebrated starting at 6:02 am on October 23rd. How will we be celebrating? With chips and Guaca-mole, of course!
As we introduce the topic to students we typically start with something they already know. A mole, like a dozen, is a way of counting things. It just so happens that a mole is a really large number. While 1 dozen equals 12, 1 mole equals 6.02 x 10²³. This number has to be very large because the particles that we deal with in chemistry happen to be very, very small (or sm-ole… the bad jokes keep on coming).
To give students a mole-ecular perspective of those tiny particles, you can use a modeling kit.

At this point in the year it is important for students to understand the basics of chemical formulas. The model kit gives them something to see and touch as they learn that subscripts in a formula represent the number of atoms that are bonded in the compound.

In addition to formulas, the model kit can be useful in calculating molar mass. Since each different colored atom represents a different molar mass, students can just take their model and add up all the masses of all the atoms that they see! In the case of water, the oxygen is 16 grams per mole and each hydrogen is 1 gram per mole. In total, there are 18 grams for every one mole of water molecules.

So how do chemists relate these tiny particles to something that they can measure, like grams? Moles to the rescue! Avogadro’s number (the number of particles in one mole) and molar mass (the amount of grams in one mole) both meet in the middle at … moles.

Moles are central to counting particles in chemistry. Using Avogadro’s number and the molar mass of water, we know that there are 6.02 x 10²³ molecules in graduated cylinder that contains 18 grams of water.

Model kits can be great tools in helping students visually and kinesthetically learn about chemical formulas. They become actively engaged in the learning process as they discover the meaning and value of subscripts, molar masses and, of course, Avogadro’s number. And as students gain a better understanding of these concepts the real fun begins— they start to really understand your science humor! “Oh no! I’ve spilled water on my book!”

Happy Mole Day!

Experiment: How Hard is Your Tap Water?

Students use conductometric titration and gravimetry to determine how much calcium carbonate is in a sample of tap water.

This lab is an introduction to methodological comparisons. Percent error is calculated for both gravimetry and titration. Samples of tap water from various locales are concentrated and analyzed for calcium content.

Student Files

  • 03_ACI_How_Hard_Is_Your_Tap_Water_S.docx
  • 03_ACI_How_Hard_Is_Your_Tap_Water_S.pdf

Standards Correlations

Featured Equipment

  • Wireless Drop Counter
    • Use the new Wireless Drop Counter for more efficient and accurate titration data. Conducting a titration has never been easier!
  • Wireless Conductivity Sensor
    • This waterproof sensor connects via Bluetooth® to measure both conductivity (ionic content in solution) and total dissolved solids.

This experiment can also be run with previous versions of PASCO sensors.

Seven Great Experiments Using the Wireless CO2 Sensor

Measuring Carbon Dioxide (CO2) has many applications in the classroom and with the latest advances in technology is easier and more affordable than ever before. Here’s a quick look at some of the cool things you can do with the new Wireless CO2 Sensor!

1. Monitor Air Quality

An engaging way to introduce students to the sensor is to use the “closed” environment that you already have access to – your classroom or lab. This is also a great opportunity to use the data logging capabilities of the sensor. Find a central place in the room to place the sensor, ideally suspended above students heads where they can’t exhale onto the sensor. Place the sensor into logging mode, and collect 8-10hrs of data (Figure 1a). Depending on the student density in your room, HVAC, how closed the environment is, you should be able to see fluctuations in the CO2 levels that correspond to the class schedule because all of those students are busy breaking down glucose and producing CO2.


Figure 1a. Data from sensor logging over a school day.


Students can repeat this test in other locations such as the cafeteria, greenhouse, bathrooms, etc. While there are conflicting standards generally a CO2 concentration of <1,000ppm is desirable and >3,500ppm people will begin to experience physiological effects. Many modern HVAC systems even have their own sensors that will cycle the air to maintain CO2 levels <1,500ppm you can probably tell from the data if you your school or lab has one!


Figure 1b. Data with bell schedule overlaid


2. Investigate Cellular Respiration

With the included sample bottle students’ can use invertebrates, germinating seeds, or other small organisms to quickly collect respiration data. Variation in environmental factors like light or temperature provide easy extensions as well as germination time, species comparisons, body mass, activity level, etc.


Figure 2. Respiration of Germinating Seeds


Extending this setup the sensor can be used with bacterial or yeast solutions, even aquatic species by measuring the gas concentration in the headspace of the container.


Figure 3. Headspace Measurement above a liquid


While a smaller chamber will yield faster results (gas concentration will change faster) sometimes a bigger chamber is needed to study larger organisms or when modeling ecosystems. This is where the wireless design is particularly helpful, the sensor can easily be placed inside any container along with the organism being studied – without any modifications. If you need to run the sensor for longer than about 18hrs, connect it to an external USB power pack or source and the sensor can continue working.


Figure 4. Sensor inside a larger food storage container


3. Investigate Photosynthesis

To get great photosynthesis data you just need a fresh dark green leaf, the sensor, and the sample bottle. Put the leaf in the bottle, cap it with the sensor and start data collection! Using the sample bottle and a fresh leaf ensures a quick response – data runs of 5-10min! Light vs. Dark and wavelength are simple and relevant manipulations for students to conduct.


Figure 5. Photosynthesis using a single Epipremnum sp. Leaf with no filter, blue filter, red, and green applied. Plants exposed to full spectrum CFL bulb for 10min runs.


Test

CO2 Rate (ppm/min)

Light (no filter)

-17

Blue Filter

-7

Red Filter

-9

Green Filter

-12

Dark (tinfoil wrapped)

+32

Table 1. Summary of change in rate found from each run of data.


And more ideas (than I have time to test): Light intensity, impact of temperature, herbivory, time of day, herbicide impact, stomata density, C3/C4/CAM Plant comparison, CO2 Concentration

4. Measure Carbon Flux in the Field

In some cases lab experiments aren’t feasible or desirable. It’s easy to take the sensor into the field using a cut bottle, bell jar, or plastic bag to isolate a plant or patch of soil for analysis without disturbing the environment. Firmly press the container into the substrate to create a tight seal and begin collecting data. Students can easily compare different ecosystems to determine if they are a net carbon producer or consumer under conditions. This technique can be repeated in different conditions, times of the day or year to compare results.


Figure 6. Cut bottle with sensor place over patch of turf


This same technique combined with the concept of measuring a headspace over a liquid to determine the gas exchange can be used to monitor carbon flux in an aquatic ecosystem. Securing the sensor with a float (or to a fix object) to protect it creates the airspace needed to measure above the water. Collect data for the day to see how a body of water is exchanging carbon with the atmosphere.


Figure 7. Using a float and cut bottle to create an airspace and measure carbon exchange


5. Monitor Respiration of Soil Microbes and Decomposers

To streamline the sample collection and measurement of soil samples students can use a section of PVC to collect a consistent volume of substrate and make the measurement in the same chamber. A 6-8in (15-20cm) section of pipe with an inner diameter of ~1.125” (3cm) can be easily pounded into the ground a specified depth to collect the sample. Seal the end of the pipe with some parafilm or plastic wrap and collect the data.


Figure 8. Sensor in PVC tube with marking for soil sample depth, clear PVC used to demonstrate


Data collection can take place in the field or lab and is easily extended for inquiry. Students can treat the samples with pH buffers, water, drying, salt, pesticides, or other chemicals of interest to determine the impact on microbe respiration.

6. Measure Human Respiration

Using a drinking straw and a 1gal (4L) ziplock® bag its easy to capture human respiration data. Here’s a video comparing breath hold time. This same procedure can be used to test other variables, before and after exercise, time of day, etc.


7. Dissolved CO2 in situ

With Dissolved CO2 Sleeve students can monitor CO2 in an aquatic environment. The Teflon® material is permeable to CO2 molecules but not to water, creating a much smaller headspace around the sensor with a better response time. While the CO2 is not dissolved when its measured this approach has been validated and tracks with other indicators such as pH (Johnson et al 2010). This approach works well in the field and in the lab for photosynthesis and respiration experiments. Below is a picture and some data we collected during betta testing!

Reference:
Johnson, M. S., Billett, M. F., Dinsmore, K. J., Wallin, M. , Dyson, K. E. and Jassal, R. S. (2010), Direct and continuous measurement of dissolved carbon dioxide in freshwater aquatic systems – method and applications. Ecohydrol., 3: 68-78. doi:10.1002/eco.95

Related Products:


Sign Up For Our Newsletter - Get Info About New Products & Teaching Ideas

Sign Up For Our Newsletter

  • A big thanks for all the help and support you provided – I want to take some time to say a big thanks for all the help and support you provided me to select the best equipment in order to make the best possible use of the funds available. It is really exceptional that you happily connected with me multiple times even during the weekend and was always motivated to help. Please accept my big thanks for this.

    Gurpreet Sidhu | Physics Instructor | University College of North | The Pas, MB

  • Wireless Spectrometer Big Hit With Students – PASCO’s wireless spectrometer has been utilized very well by our earth science and physical science teachers. It’s an excellent piece of equipment and we have very much enjoyed its addition to enriching our classroom. It definitely brings students to a higher level of understanding wave interaction at a molecular level.

    Matt Tumbach | Secondary Instructional Technology Leader | Tommy Douglas Collegiate | Saskatoon, SK

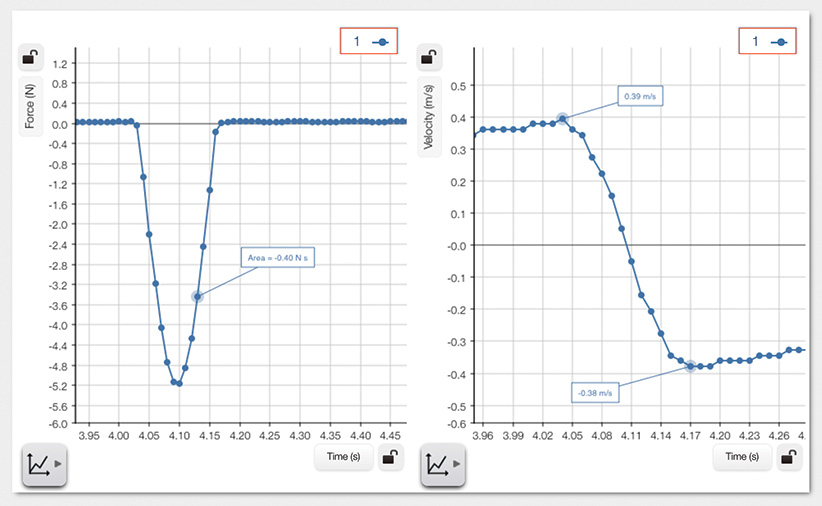
  • Excellent Smart Cart – I thought the cart was excellent. The quick sampling rate for force will be very useful for momentum and collision labs we do. I’m recommending we include this in our order for next school year.

    Reed Jeffrey | Science Department Head | Upper Canada College | Toronto ON

  • Your lab equipment is of the highest quality and technical support is always there to help. During the 25 years we have used a wide array of lab equipment including computer interfacing. Your Pasco line has a high profile in our lab and will continue to do so far into the future.

    Bob Chin | Lab Technician | Kwantlen Polytechnic University | Surrey, BC

  • Datalogging Activities are Cross-Curricular

    Throughout the province of Nova Scotia, PASCO’s probeware technology has been merged with the rollout of the new P-6 curriculum. We chose a number of sensors for use with our project-based activities. Both the functionality and mobility of PASCO’s dataloggers enable students to collect authentic, real-world data, test their hypotheses and build knowledge.

    Mark Richards | Technology Integration Consultant | Annapolis Valley R.S.B. | Nova Scotia

  • We have a large number of PASCO wireless spectrometers and love how they have improved the learning experience for our students.

    Shawn McFadden | Technical Specialist | Ryerson University | Toronto, Ontario

  • During distance learning due to COVID-19 school shut down, I was given a short window to collect what I could from my classroom to teach online. The PASCO wireless sensors and Smart Carts were my top priority to collect to implement distance learning. By sharing experimental data with students via SPARKVue, the sensors were pivotal in creating an online experience that still allowed students to grow with their lab skills. It was easy to record videos of the data collection and share the data with my students. They did a phenomenal job examining and interpreting the data.


    Michelle Brosseau | Physics Teacher | Ursuline College Chatham | Chatham, Ontario

Exclusive Canadian Distributor
for PASCO Scientific

Contact Us

7-233 Speers Road
Oakville, ON Canada L6K 0J5
Toll Free: 1-877-967-2726
Phone: 905-337-8486
Technical Support: 1-877-967-2726  ext. 713
PASCO Support: 1-800-772-8700 ext. 1004
Order Form:  2022 AYVA Order Form

Save & Share Cart
Your Shopping Cart will be saved and you'll be given a link. You, or anyone with the link, can use it to retrieve your Cart at any time.
Back Save & Share Cart
Your Shopping Cart will be saved with Product pictures and information, and Cart Totals. Then send it to yourself, or a friend, with a link to retrieve it at any time.
Your cart email sent successfully :)