Measuring Carbon Dioxide (CO2) has many applications in the classroom and with the latest advances in technology is easier and more affordable than ever before. Here’s a quick look at some of the cool things you can do with the new Wireless CO2 Sensor!
1. Monitor Air Quality
An engaging way to introduce students to the sensor is to use the “closed” environment that you already have access to – your classroom or lab. This is also a great opportunity to use the data logging capabilities of the sensor. Find a central place in the room to place the sensor, ideally suspended above students heads where they can’t exhale onto the sensor. Place the sensor into logging mode, and collect 8-10hrs of data (Figure 1a). Depending on the student density in your room, HVAC, how closed the environment is, you should be able to see fluctuations in the CO2 levels that correspond to the class schedule because all of those students are busy breaking down glucose and producing CO2.
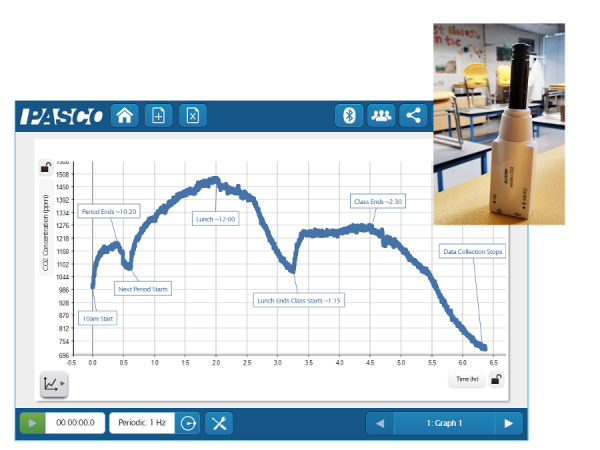
Figure 1a. Data from sensor logging over a school day.
Students can repeat this test in other locations such as the cafeteria, greenhouse, bathrooms, etc. While there are conflicting standards generally a CO2 concentration of <1,000ppm is desirable and >3,500ppm people will begin to experience physiological effects. Many modern HVAC systems even have their own sensors that will cycle the air to maintain CO2 levels <1,500ppm you can probably tell from the data if you your school or lab has one!
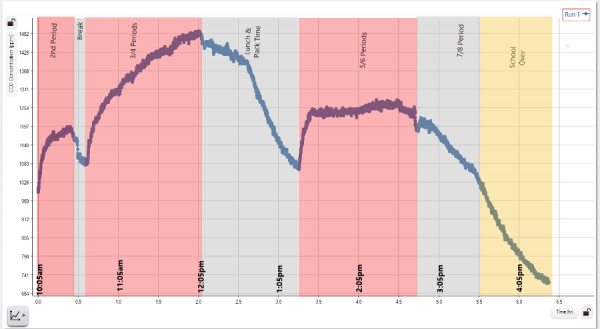
Figure 1b. Data with bell schedule overlaid
2. Investigate Cellular Respiration
With the included sample bottle students’ can use invertebrates, germinating seeds, or other small organisms to quickly collect respiration data. Variation in environmental factors like light or temperature provide easy extensions as well as germination time, species comparisons, body mass, activity level, etc.
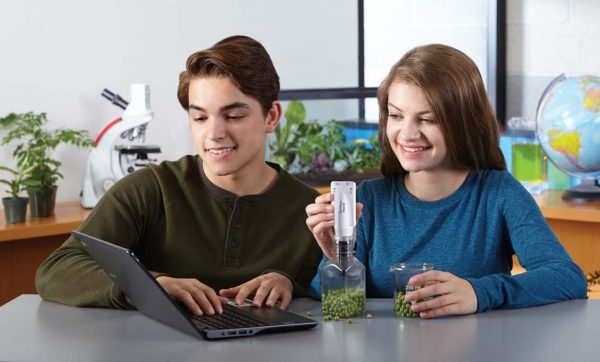
Figure 2. Respiration of Germinating Seeds
Extending this setup the sensor can be used with bacterial or yeast solutions, even aquatic species by measuring the gas concentration in the headspace of the container.
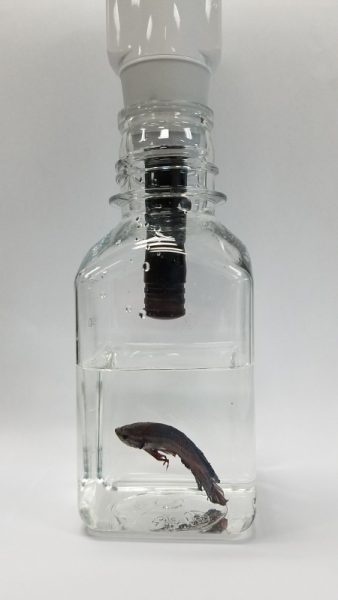
Figure 3. Headspace Measurement above a liquid
While a smaller chamber will yield faster results (gas concentration will change faster) sometimes a bigger chamber is needed to study larger organisms or when modeling ecosystems. This is where the wireless design is particularly helpful, the sensor can easily be placed inside any container along with the organism being studied – without any modifications. If you need to run the sensor for longer than about 18hrs, connect it to an external USB power pack or source and the sensor can continue working.
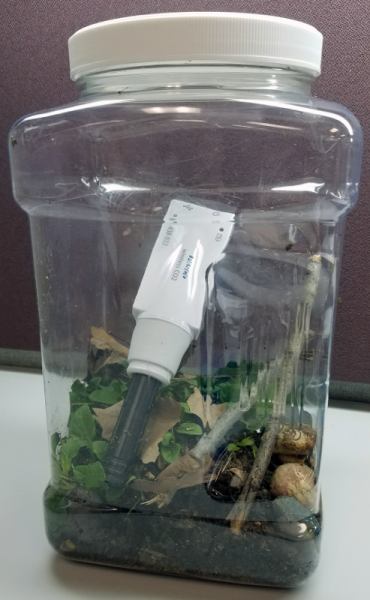
Figure 4. Sensor inside a larger food storage container
3. Investigate Photosynthesis
To get great photosynthesis data you just need a fresh dark green leaf, the sensor, and the sample bottle. Put the leaf in the bottle, cap it with the sensor and start data collection! Using the sample bottle and a fresh leaf ensures a quick response – data runs of 5-10min! Light vs. Dark and wavelength are simple and relevant manipulations for students to conduct.
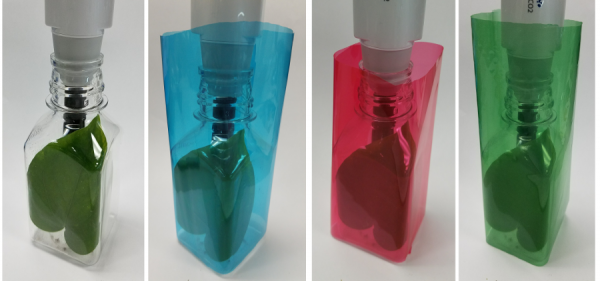
Figure 5. Photosynthesis using a single Epipremnum sp. Leaf with no filter, blue filter, red, and green applied. Plants exposed to full spectrum CFL bulb for 10min runs.
|
Test
|
CO2 Rate (ppm/min)
|
|
Light (no filter)
|
-17
|
|
Blue Filter
|
-7
|
|
Red Filter
|
-9
|
|
Green Filter
|
-12
|
|
Dark (tinfoil wrapped)
|
+32
|
Table 1. Summary of change in rate found from each run of data.
And more ideas (than I have time to test): Light intensity, impact of temperature, herbivory, time of day, herbicide impact, stomata density, C3/C4/CAM Plant comparison, CO2 Concentration
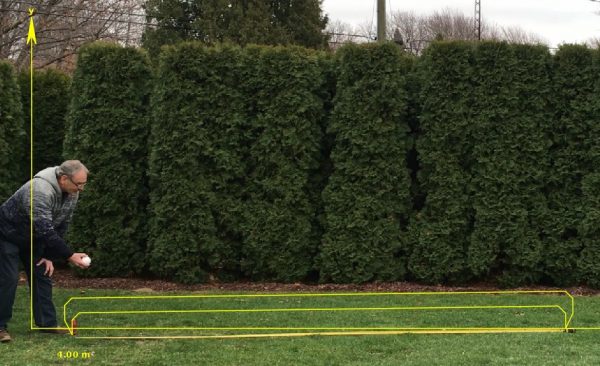
4. Measure Carbon Flux in the Field
In some cases lab experiments aren’t feasible or desirable. It’s easy to take the sensor into the field using a cut bottle, bell jar, or plastic bag to isolate a plant or patch of soil for analysis without disturbing the environment. Firmly press the container into the substrate to create a tight seal and begin collecting data. Students can easily compare different ecosystems to determine if they are a net carbon producer or consumer under conditions. This technique can be repeated in different conditions, times of the day or year to compare results.
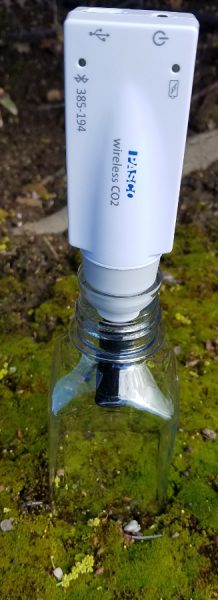
Figure 6. Cut bottle with sensor place over patch of turf
This same technique combined with the concept of measuring a headspace over a liquid to determine the gas exchange can be used to monitor carbon flux in an aquatic ecosystem. Securing the sensor with a float (or to a fix object) to protect it creates the airspace needed to measure above the water. Collect data for the day to see how a body of water is exchanging carbon with the atmosphere.
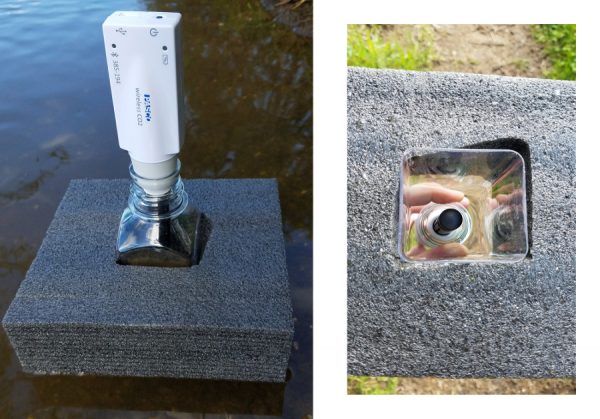
Figure 7. Using a float and cut bottle to create an airspace and measure carbon exchange
5. Monitor Respiration of Soil Microbes and Decomposers
To streamline the sample collection and measurement of soil samples students can use a section of PVC to collect a consistent volume of substrate and make the measurement in the same chamber. A 6-8in (15-20cm) section of pipe with an inner diameter of ~1.125” (3cm) can be easily pounded into the ground a specified depth to collect the sample. Seal the end of the pipe with some parafilm or plastic wrap and collect the data.
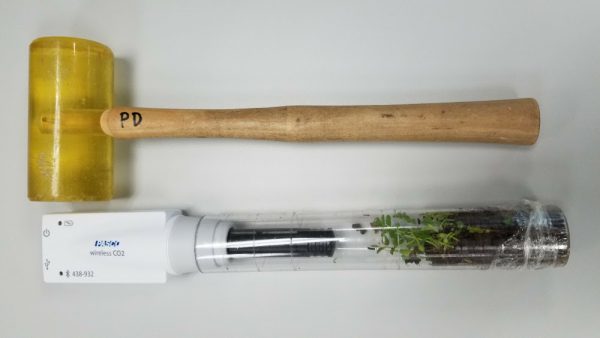
Figure 8. Sensor in PVC tube with marking for soil sample depth, clear PVC used to demonstrate
Data collection can take place in the field or lab and is easily extended for inquiry. Students can treat the samples with pH buffers, water, drying, salt, pesticides, or other chemicals of interest to determine the impact on microbe respiration.
6. Measure Human Respiration
Using a drinking straw and a 1gal (4L) ziplock® bag its easy to capture human respiration data. Here’s a video comparing breath hold time. This same procedure can be used to test other variables, before and after exercise, time of day, etc.
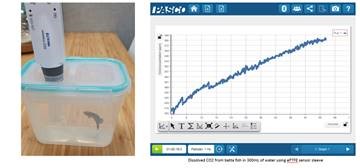
7. Dissolved CO2 in situ
With Dissolved CO2 Sleeve students can monitor CO2 in an aquatic environment. The Teflon® material is permeable to CO2 molecules but not to water, creating a much smaller headspace around the sensor with a better response time. While the CO2 is not dissolved when its measured this approach has been validated and tracks with other indicators such as pH (Johnson et al 2010). This approach works well in the field and in the lab for photosynthesis and respiration experiments. Below is a picture and some data we collected during betta testing!
Reference:
Johnson, M. S., Billett, M. F., Dinsmore, K. J., Wallin, M. , Dyson, K. E. and Jassal, R. S. (2010), Direct and continuous measurement of dissolved carbon dioxide in freshwater aquatic systems – method and applications. Ecohydrol., 3: 68-78. doi:10.1002/eco.95


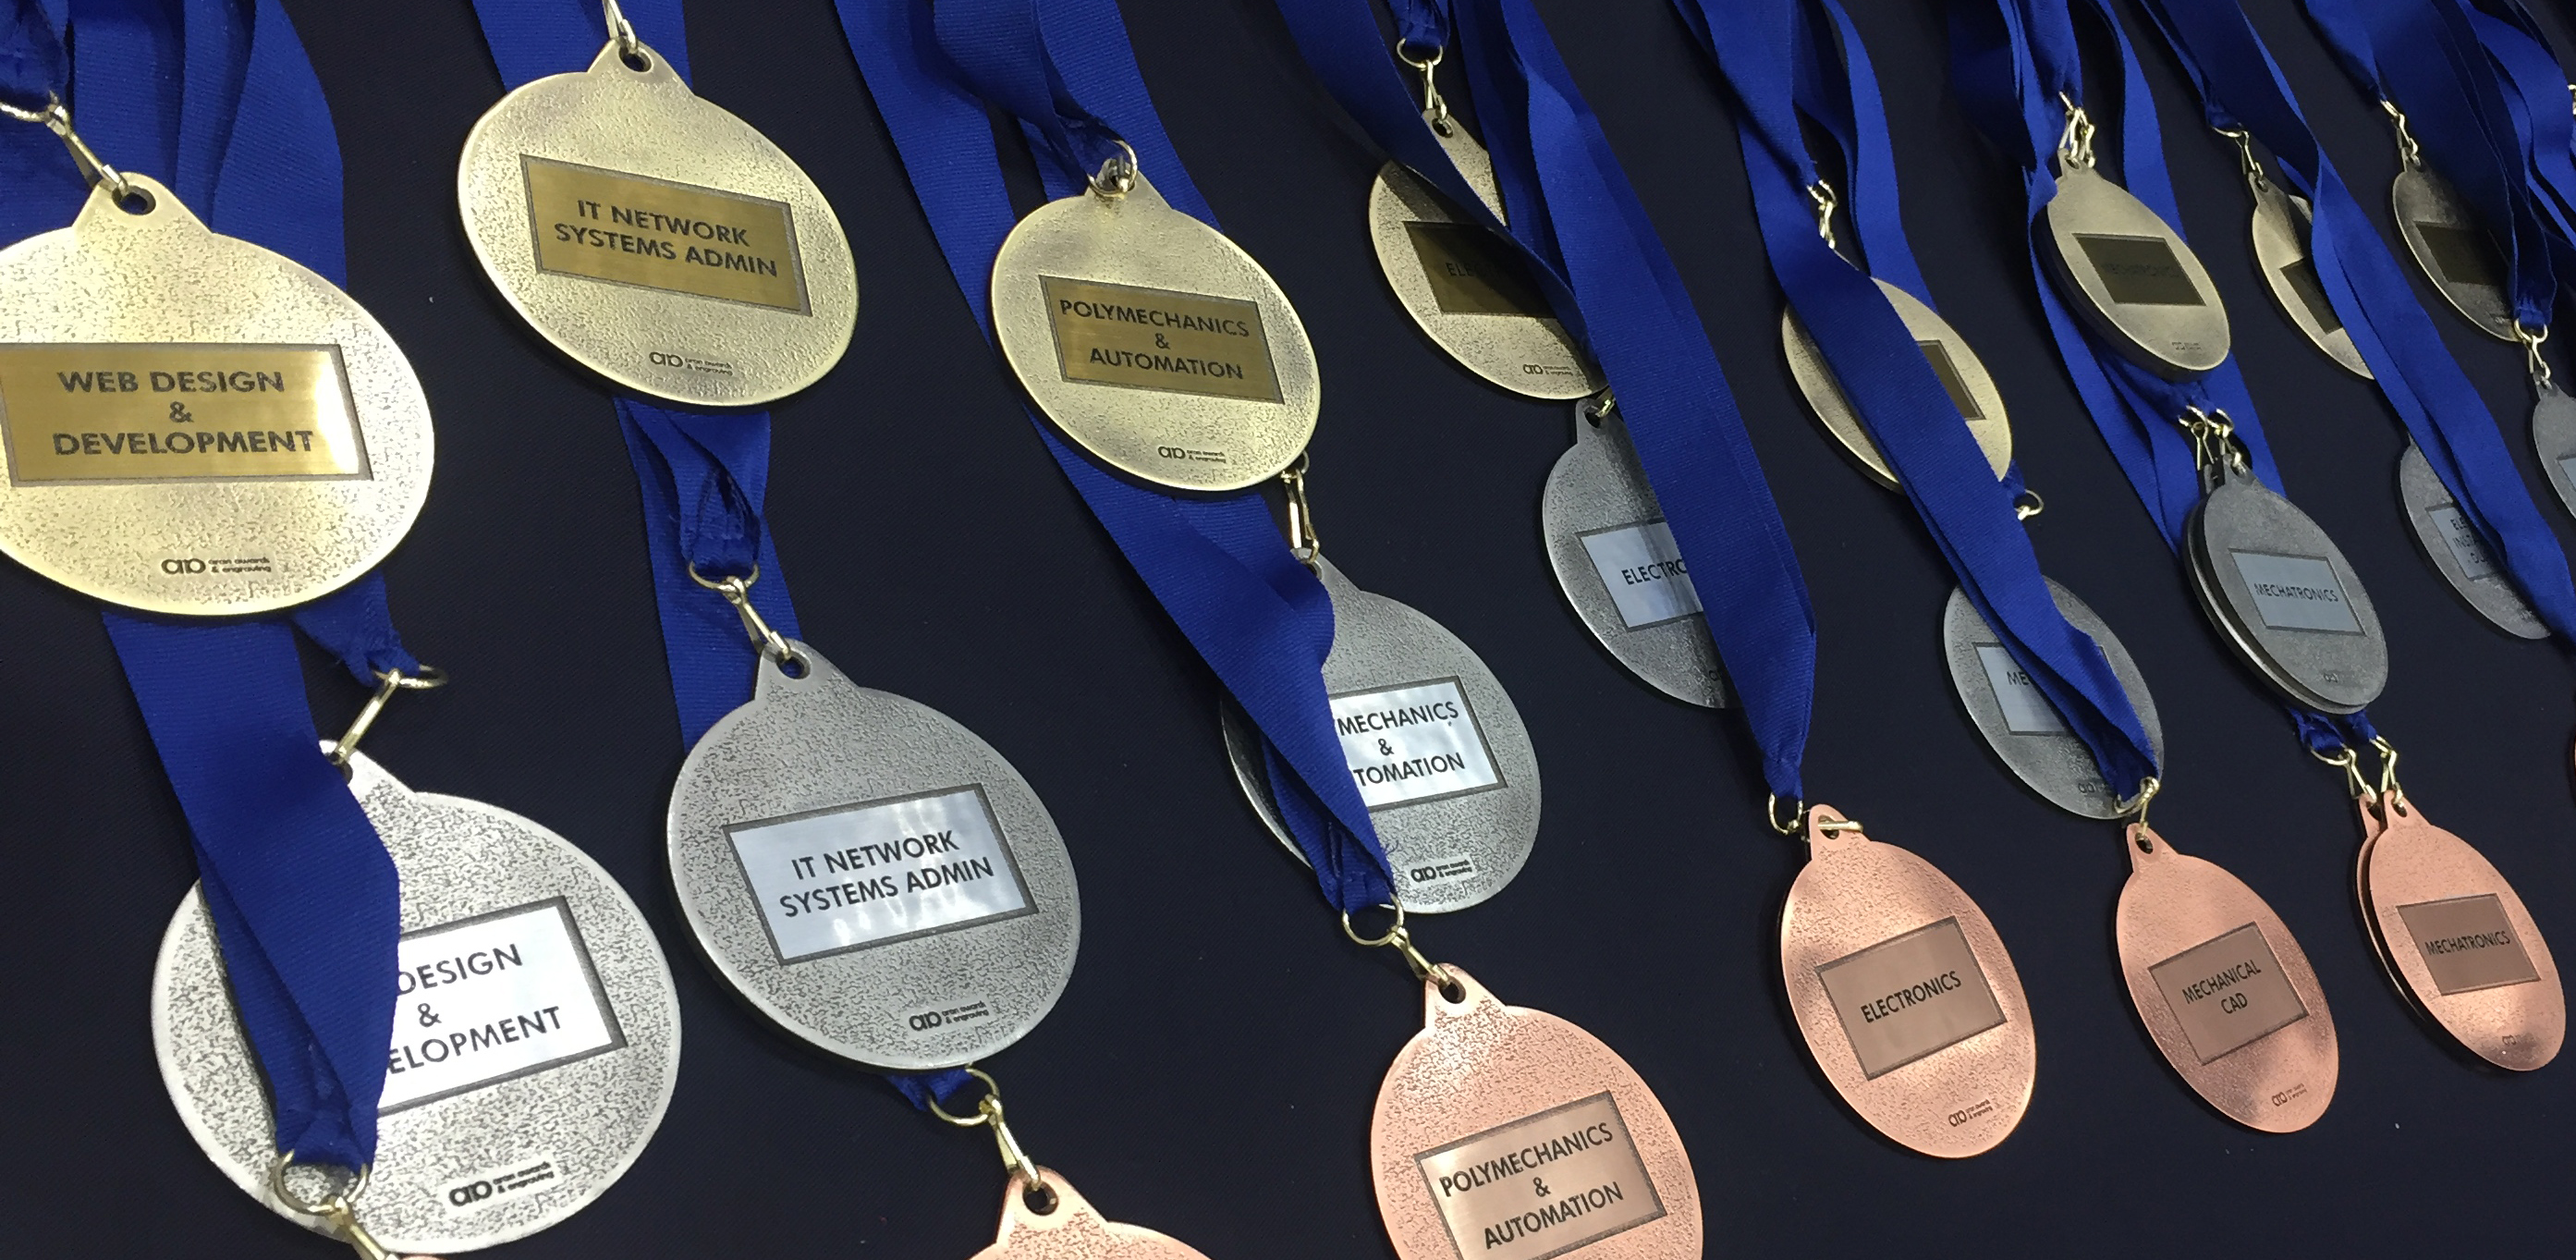
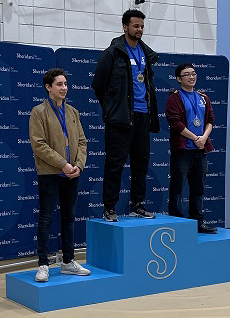 Sheridan College (Davis Campus) conducted their 3rd annual Skills Competition on March 4th, 2020, a day dedicated to recognize and celebrate the accomplishments of the students from various programs within the Faculty of Applied Science and Technology. Previously, professors selected their top students to compete in the Skills Ontario competition but with Sheridan’s new Skills Trade Centre, a more engaging way to select the students was brought forward.
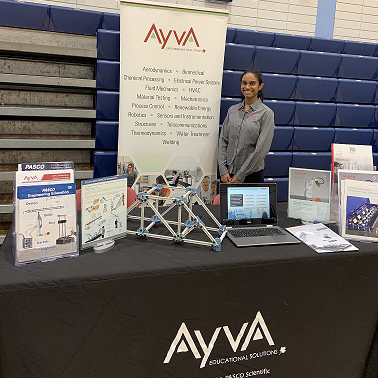 AYVA was proud to be a sponsor for this years’ event. It was an honour to be able to witness the extraordinary projects presented by the students.