What Prevents Students from Pursuing STEM (And Why I Pursued It Anyway)
Article after article highlights the lack of diversity in STEM – not enough women, not enough racial minorities, not enough people from lower socioeconomic classes. There are also articles that dispute that the STEM gender gap doesn’t exist and that there are equally as many female STEM graduates as their male counterparts (that will be covered in a future blog).
Numbers aside, today I will be covering a few reasons why students don’t feel that a STEM career is an option for them and how I pursued one despite these reasons.
Some of the commonly cited reasons for students avoiding STEM are the lack of role models in these fields, peer pressure, and overall perception of STEM.
So why do people avoid STEM?
Students typically dismiss science educations because they do not see many role models that they identify with in this field. They feel that they would not fit in or underestimate their skills to pursue such a degree.
In a study by Microsoft, it was determined that having effective role models and support from parents and mentors are needed for females to see themselves in a STEM role. Exposure to STEM activities and real-world applications also influenced how females perceive STEM jobs and their class choices later in their life.
Although this study focused on women in STEM, these environmental factors can also influence students of different ethnicities, orientations, and abilities. Everybody has a different identity – it is important to realize that not one person fits into one single group. But the approach to encourage more students to pursue a science education is the same: good role models, a support system from educators and family, and exposure to science in different contexts.
Why I Still Ended Up in STEM
Although I had decided that I wanted to study science in high school, I nearly didn’t go into chemistry. My high school had a large proportion of students taking at least one senior science and many graduates pursued post-secondary educations in STEM. Science was something that all of my peers were doing and it was something that I excelled in so I decided to take all three courses offered (biology, physics, chemistry).
I loved my chemistry class – I did extremely well and it was so interesting to me. However, I was considering biology as a major because I didn’t excel in grade 11 physics and a chemistry major relied heavily on some physics concepts. Half of my friends were going into biology or healthcare but I couldn’t find a biology major that I was really interested in and I definitely did not want to go into nursing. At the time I was worried about risking my university acceptance average by taking such a difficult subject like grade 12 physics.
I reluctantly took grade 12 physics after consulting with my physics teacher even though I could get into my desired chemistry programs without it. Only a few of my friends were taking physics and I felt like everybody in my class smarter than me. The majority of my classmates were going into either engineering, computer science or pure physics.
I had many people in my life that encouraged me to pursue a chemistry degree but it was my physics teacher that helped solidify my choice.
My high school physics teacher was female and she was one of the best teachers in the school. To see a woman teach one of the hardest courses in the curriculum was quite encouraging for me especially since I doubted my abilities amongst my predominantly male pre-engineering peers.
She always tried to do what was best for her students which included telling us some hard truths. Her class also humbled me – I learned how to fail in her class and come out better. Even though I didn’t do as well in her class compared to my other courses, I finished that course feeling like I earned the mark.
Because of her support, I was able to picture myself studying chemistry and to not fear physics. She was always open to providing extra help and giving honest advice on university program choices.
I also had amazing support from my female peers in that class – the class went from 25 students at the beginning of the semester to about 7 by the end of the semester. Half of the students left in our little group were female including me and the entire class became more of a study group than an actual class. The small class size and the fact that I was not the only girl in the room helped me persevere through grade 12 physics. All of the females in that class ended up pursuing degrees in the physical sciences or engineering.
That is just one example of how being taught by somebody and being surrounded by peers that I identify with empowered me to study chemistry. This is why support, role models, and outreach programs are vital for encouraging more underrepresented groups to choose STEM careers.
Despite this, there are still other major reasons other than underrepresentation as to why Canada doesn’t have enough STEM graduates which will all be covered in next week’s blog!
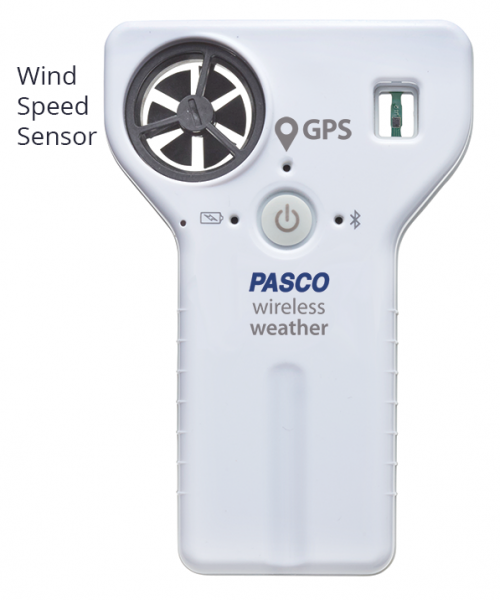
 My name is Katrina and I started at AYVA in January as a co-op student from the University of Guelph. I am a Biological and Pharmaceutical Chemistry major and STEM education has always been something that I am passionate about. I feel like I am in a unique position to help improve it through AYVA as a student who has recently experienced secondary science education and is currently studying science in university. I have some perspective on how technology can be used to improve learning having used PASCO technology both in high school and university.


 The Augustana Campus chemistry labs have traditionally been perfectly acceptable, but have yielded somewhat standard chemistry experiments with very typical analysis. As a satellite campus of the University of Alberta, located in Camrose, Alberta, we have strived to be almost an extension of our North Campus sibling, which has proved problematic within the constraints of a 100 kilometers distance. Recently, things have changed. Last summer, we diverged from this straightforward and customary path and decided to do something slightly different. Along with our newly renovated labs—that encourage thought and collaboration—we have fundamentally changed our first-year chemistry lab experiments, which mean that different analyzation techniques are needed. Gone are vitamin C titrations with Tang and tablets, replaced by extraction techniques and spectral analysis. Hand-held spectroscopes have been replaced with a fiber optic cable in a light emissions lab while also adding a light measurement for chemiluminescence.
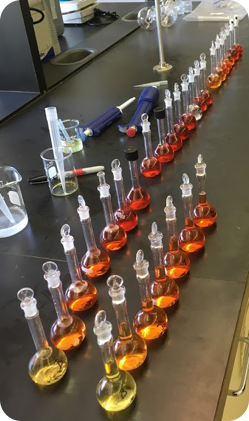 Our previous vitamin C laboratory experiment was based in a traditional vein, where titrations were used to determine the vitamin C content in both Tang (a powdered orange drink very few students today have ever experienced) and 500mg vitamin C tablets. Being a “traditional” lab exercise meant that most students likely had seen this done in high school or had done this very titration themselves. Our goal was to create an experience where the students learn a new analytical technique by extracting vitamin C from a pepper, then determining the vitamin C concentration from a standard calibration curve on a
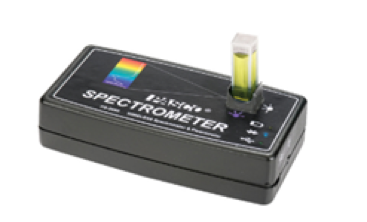
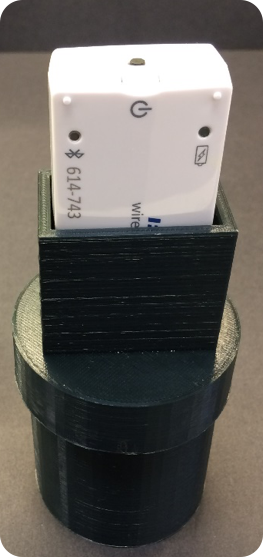
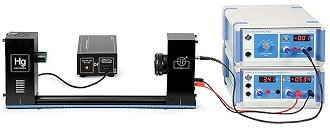
 Light emissions lab experiments can be tedious at best. You need to constantly be looking through a hand-held spectroscope, which is exactly what we were asking our students to do. Also, we were looking at lights, flame tests and emission tubes with said spectroscopes. Throughout all of this, we weren’t asking the students to really do anything else, chemically speaking. Chemiluminescence and chromatography columns were two things we decided to add into our updated labs, along with the fiber optic cable accessory for the Wireless Spectrometers (as well as scaling back the spectroscope use). In the first part of our experiment, students would activate a glow stick and add the content to our 3D printed Light Calorimeter, then read the light emitted using the
 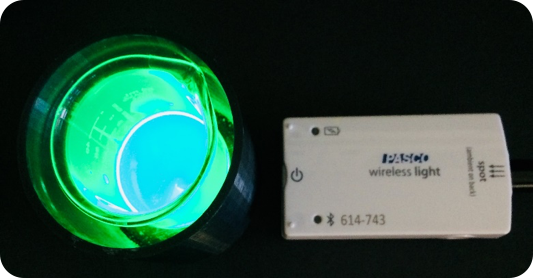 By using this method, we wanted students to learn not only about columns and their ability to separate mixtures but also to get comfortable learning how to collect data using a sensor and a data logger (in this case an iPad). In the second part of our experiment, we still use traditional light emission tubes (Argon, Helium, etc.) where we use spectroscopes to obtain the emission spectrum lines. For the hydrogen tube, however, we set up the
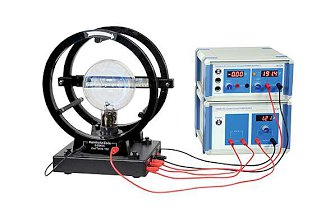
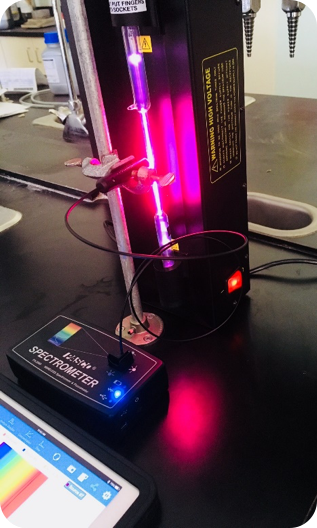
 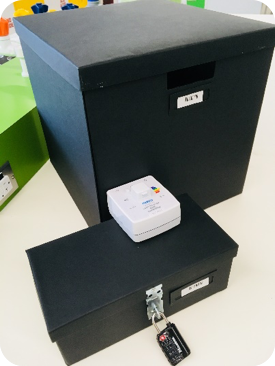 Since the wireless sensors are easily incorporated into our lab designs, we have set our sights on adding the brand new
 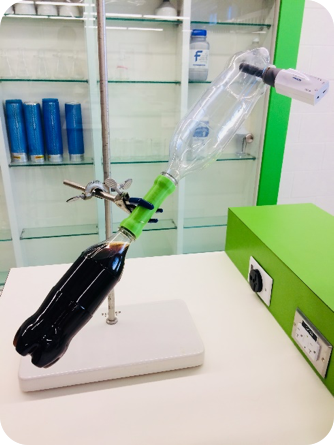 We also have a unique