English Français

1-877-967-2726

Month: November 2016

Under Pressure – Wireless sensor inside a balloon!

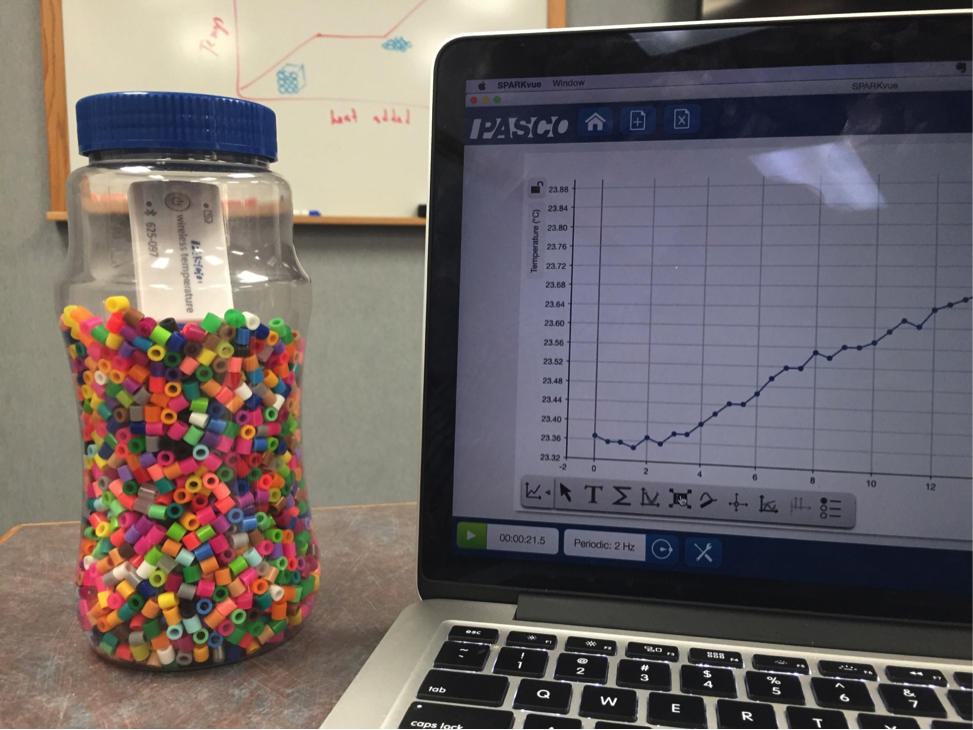
When introducing pressure and gas laws, I have always used balloons as a conceptual starting point because they are a familiar item to students. Unfortunately, I could not easily measure the actual pressure inside of the balloon— until now. The Wireless Pressure sensor make this possible and very easy.  Pretty amazing right?  What’s next, life on mars?

pb1

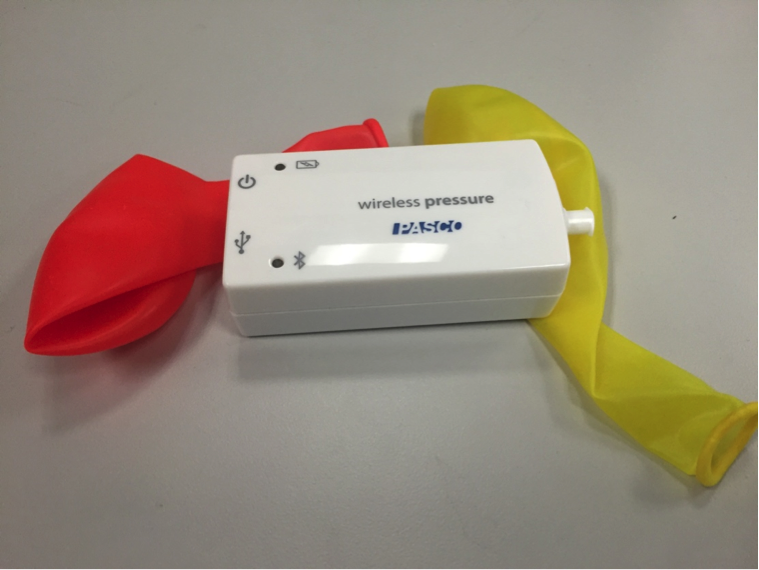
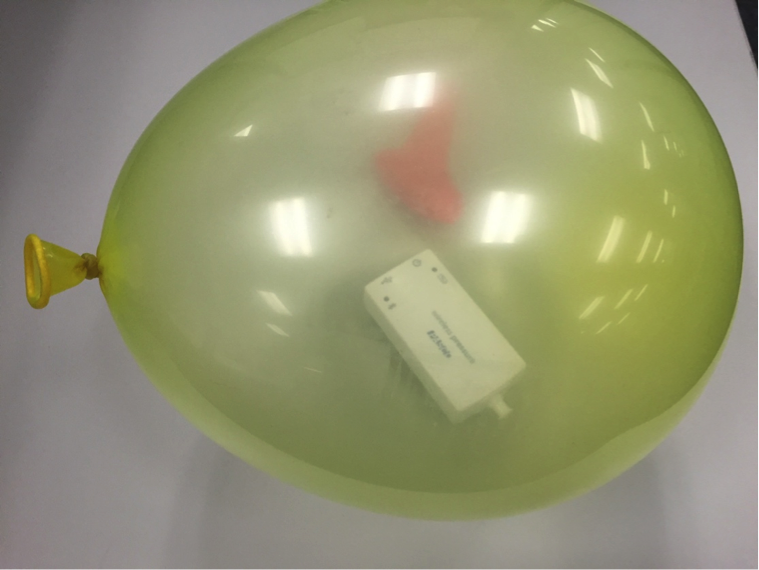
Even for those that are absolute beginners to pressure studies, this is a fun experiment, one that’s sure to garner you great fame among your students. Using a slightly larger balloon, and a little patience, the students who are able to get the pressure sensor into the balloon will definitely be heroes (if just for one day)

Now, with the sensor secured inside the balloon, let’s dance— or at least begin the experiment. Turn the sensor on and connect it to your device so your students can commence a countdown and start collecting data while they inflate the balloon!

pb2

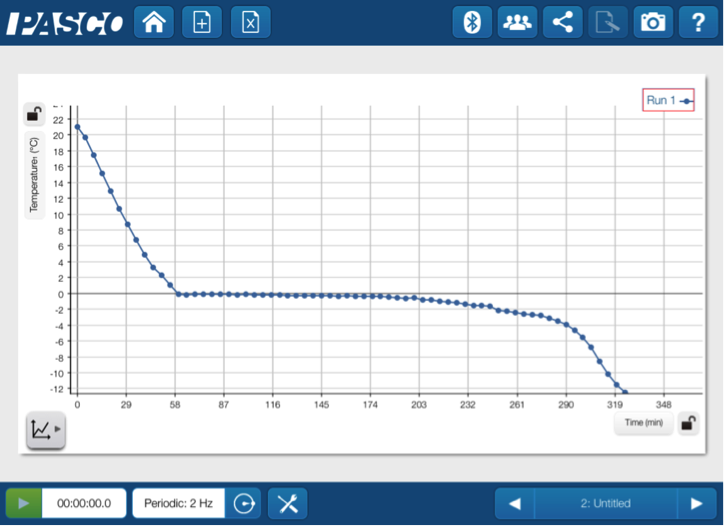
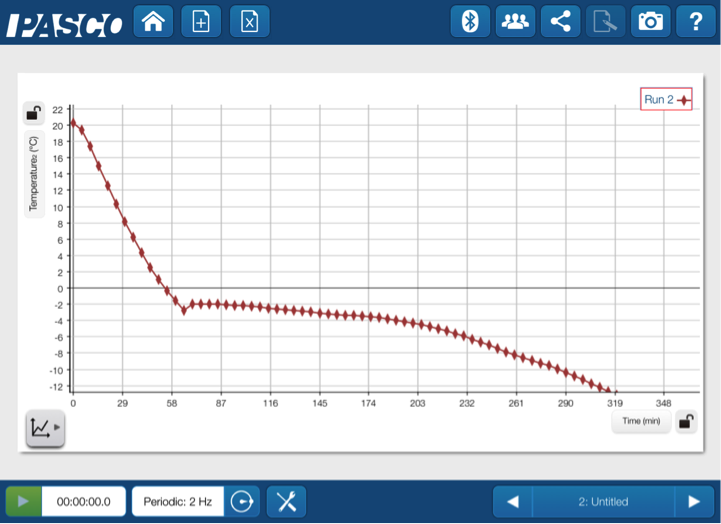
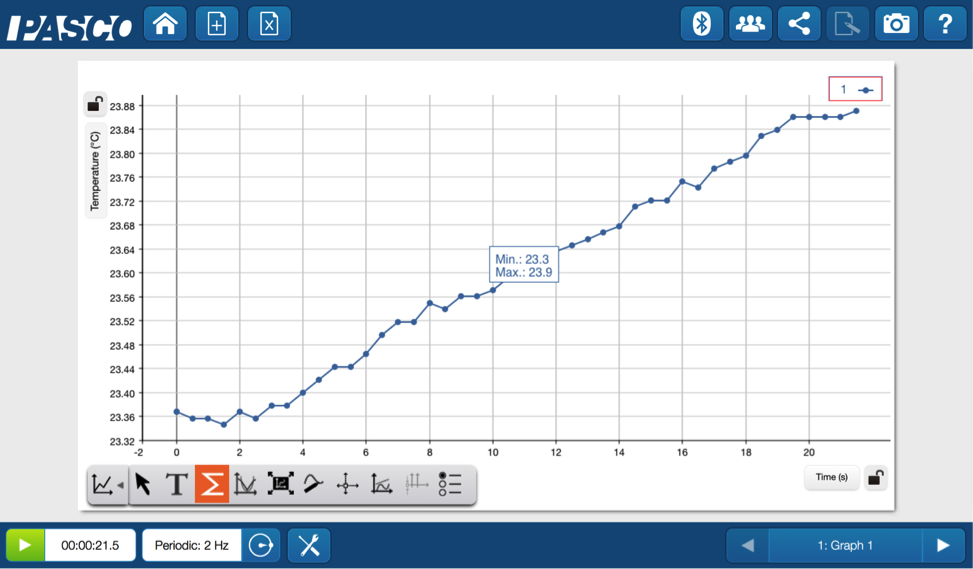
The analysis tools in SPARKvue, allow the students to observe the pressure ch-ch-changes over time.

pb3

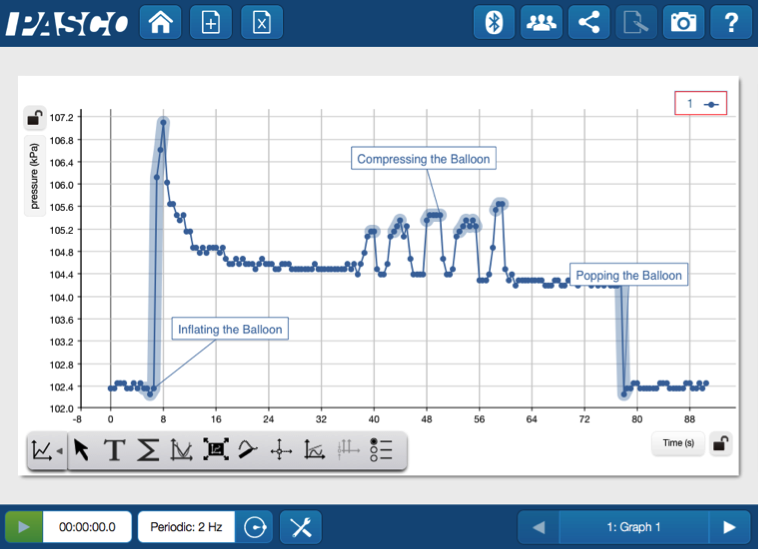
Some things to initially note could be the slight increase in pressure as the balloon is inflated, the changes in pressure as the balloon is compressed and the sharp decrease in pressure as when the balloon is popped. It’s a fantastic voyage through the many phases of the pressure change.  Seeing data displayed in real time helps connect the science behind the sound and vision of a balloon popping.

Now that they have been engaged by the activities and explored the data (and before they start to act like a rebel, rebel) try having the students explain and elaborate on what is happening and why.

With this activity only taking a few minutes to complete it can be used as a demo, as a quick investigation or it can be grouped with a few other basic investigations where students move station to station to learn about gases. And as students begin to construct their knowledge about gas properties using familiar items, you can incorporate the empirical gas laws leading up to the ideal gas law.

To make this a truly memorable lesson, you and your students should be listening to “Under Pressure” by Queen and David Bowie while performing the activity.   All the young dudes (and dudettes) will enjoy this one.


Engaging STEM (STEAM) Activities for Girls

Exposure to opportunities for learning

It is important to expose young girls to STEM fields so that they are more likely to embrace science and math when they reach high school. Science and technology are and will continue to be important factors in what we are able to accomplish in our lifetimes.

stem_girls

Addressing a real-world problem and challenging students to use science, technology, engineering and math to solve it can encourage young girls to maintain their interest in STEM fields. Innovative inquiry-based, technology infused STEM.

PASCO has 4 STEM Modules including:

  • Air Bag
  • Biosphere
  • Egg Drop
  • Collisions

These STEM Modules are all available for free download in the PASCO Digital Library under the STEM tag.

Each of these discreet modules challenges students to combine Science, Technology, Engineering and Math concepts in pursuit of a solution to a particular challenge.

HS STEM Biosphere Module catalog

Being an information-rich society, students should be encouraged to explore the numerous websites of professional organizations such as the The Scouting Life, Society of Women Engineers, Women in Technology International, Association for Women in Mathematics and Association of Women in Science, to name just a few. These resources present a tremendous opportunity to learn a great deal about the field, about what it’s like to be a woman in a specific STEM profession, about career opportunities etc.

stemjobsindemand


Popsicle Phase Change

Phase changes are an important part of chemistry and physical science curriculum — and Freeze Pops are an important part of everyone’s summer. What better way to take the edge off the summer heat than combining the two to make a cool activity that addresses changing states of matter?

In the science lab, temperature measurements will help crystalize students’ thoughts around freezing and connect the phase change with particle motion.

asset_upload_file986_192113

To set up this cool experiment, you’ll need to get a base line temperature change of pure water as well as the temperature change of the Freeze Pop. First, pour some water into a plastic container and add a Wireless Temperature Sensor. Next, we’ll open two Freeze Pops (that haven’t been frozen), pour the contents into another plastic container and add a second Wireless Temperature Sensor. Now you can use SPARKvue’s remote logging capabilities and put everything in the freezer. And if you really want to sweeten the inquiry, add some additional Freeze Pops as a tasty post-experiment treat!

The Wireless Temperature Sensor can remotely log data for days, but we’ll only needed a few hours. After letting the samples set overnight, it was time to check the results.

asset_upload_file155_192113

The samples look frozen. Let’s check SPARKvue to see if the data is just as solid.

asset_upload_file928_192113

I started by checking out the water. No brain freeze here— that’s just cool data.

The students will notice that the temperature dropped to 0oC, and stayed there before dropping again to the temperature of the freezer. But what’s so special about 0oC and why the plateau?

The students may know that this is the freezing point of water. But they may not realize that the water sample can’t get below the freezing point until the entire sample is frozen. This is where particle illustrations become important.

asset_upload_file289_192113

As the water molecules cool, they slow down into a regularly repeating pattern forming a solid. But why the plateau? As long as there are some faster, freely-moving water molecules in the sample, there will be an equilibrium between the liquid water and the ice keeping the temperature constant. Once all of the water molecules are moving slow enough to be frozen and in the solid state, then the temperature can begin to drop again.

asset_upload_file797_192113

Is the same thing happening with the Freeze Pop? It’s a good thing we have hours worth of data to find out!

This sample, which is not pure water, froze at a temperature that is lower than zero. The freezing point is depressed— but you shouldn’t be. This always happens with a solution. The other particles in the sample (sugar and dyes mostly) get in the way of the solid-liquid water equilibrium and lower the Freeze Pop freezing point.

Students may also note that there is not a flat plateau during freezing. As the water freezes out, the sample gets more concentrated with the “other” particles, depressing the freezing point even more. The freezing slope isn’t steep enough for sledding, but it is definitely noticeable. Once the entire sample is frozen, the temperature decrease is more dramatic.

The concept of freezing point depression is important and it has real practical applications— from making Freeze Pops and ice cream, to car antifreeze and melting ice in the winter.

Now your students can not only understand freezing, but they can explore factors that would affect freezing point depression. I am sure this would open up the lab to 31 flavors of ice cream inquiry!

Temperature misconceptions? Shake it off.

Most students understand that things get warmer as temperature goes up, but it is in the science lab that we have an opportunity to really help them understand what temperature means. One of the core ideas in Physical Science is that temperature is actually a measure of the kinetic energy of the particles of the matter. But when you’ve only thought about temperature as being hot or cold, this is an especially difficult concept because the “particles of matter” are hard to visualize.

One way to bring this concept into focus is to model the sub-microscopic world with something that the students can physically manipulate. We’ll shake things up in the lab by  modeling molecules with some craft beads.

Temperature

To measure the temperature, I used a Wireless Temperature Sensor and SPARKvue software. After placing sensor into an empty jar with the beads, I just needed to add some energy. Next step… just shake that jar thing. With a wireless sensor this is easy—just put the lid on and shake it up

Temperature Graph

I imagine that an entire class of student shaking these beads could be quite a cacophony. These engaged students would definitely see (and hear) the motion of the particles inside their sample of matter. You may need to reign them in a bit and remind them that they should “shake it, don’t break it.”

We know the dancing around turned up the heat in your class, but did all of this movement affect the temperature in the jar? Let’s take a closer look at the data.

One way to bring this concept into focus is to model the sub-microscopic world with something that the students can physically manipulate. We’ll shake things up in the lab by  modeling molecules with some craft beads.

They say fakers gonna fake, fake, fake, fake, fake, but the data doesn’t lie. While the temperature increase was small, we can clearly see that the sensor did measure a steady increase in the temperature.

Now that they have the basic idea of temperature, you can have the students tune their own own investigation to determine the relationships among the energy transferred, the type of matter, the mass, and the change in the average kinetic energy of the particles as measured by the temperature of the sample.

While the students are devising plans (and of course competing to see who can change the temperature the most), you can rest assured that they are understanding disciplinary core ideas and incorporating engineering practices and cross cutting concepts.

AST 2016 – Nova Scotia goes with PASCO!

AYVA was proud to participate in the annual Nova Scotia Association of Science Teachers science conference (AST) again this year. The conference offered a broad range of sessions pertaining to the many disciplines of K-12 science. This is a particularly exciting year for science students in Nova Scotia since the Department of Education & Early Childhood Development provided nearly 300 local elementary schools with SPARKvue software and PASCO sensors for hands-on, inquiry-based learning.

Three PASCO workshops were offered over the course of the conference, enabling teachers to become acquainted with their new datalogging technology which pairs seamlessly with the Chromebooks and iPads. Probeware allows students to collect, manipulate and analyze data from various sources to support observations and help make inferences and conclusions about the world around them. Participants were able to observe how true open-ended inquiry becomes much easier when real world data is collected in a timely fashion. Teachers had a chance to demo the new line of wireless sensors and were given several streamlined curriculum activities to take back to their classrooms. Many instructors stopped at the AYVA booth to ask about the new equipment and to talk about the new materials that were sent out to grades 4-6 this year. Our special thanks go to all the attending teachers and our amazing team of presenters: Wes Leblanc (Chemistry Teacher, HRSB), Mark Richards (Consultant of Technology Integration-AVRSB) and Nancy Chisholm (IT Consultant).

file2

Save & Share Cart
Your Shopping Cart will be saved and you'll be given a link. You, or anyone with the link, can use it to retrieve your Cart at any time.
Back Save & Share Cart
Your Shopping Cart will be saved with Product pictures and information, and Cart Totals. Then send it to yourself, or a friend, with a link to retrieve it at any time.
Your cart email sent successfully :)