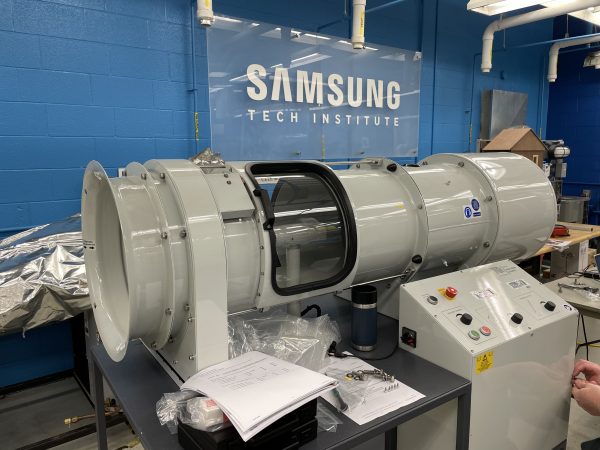
Working with TecQuipment’s Wind Turbine Dynamics Apparatus
Last Friday, I was given the opportunity to take a trip to Centennial College alongside a colleague of mine to help a group of professors with the assembly of the TecQuipment AE1005V Wind Turbine Dynamics Apparatus. The apparatus is comprised of a bell shaped mouth and honeycomb to reduce turbulent airflow, a silencer to reduce excessive noise, an anemometer to record wind speed, and a digital display for pitch, yaw, fan speed, and turbine speed, all of which are adjustable. We arrived at the campus early in the morning, where we met with our contact at the school. He led us through the college into the machine shop and we began to assemble the AE1005V.
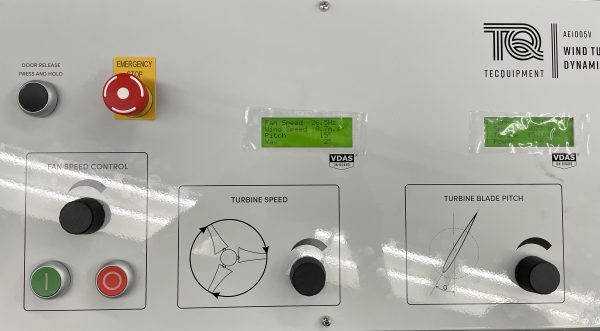
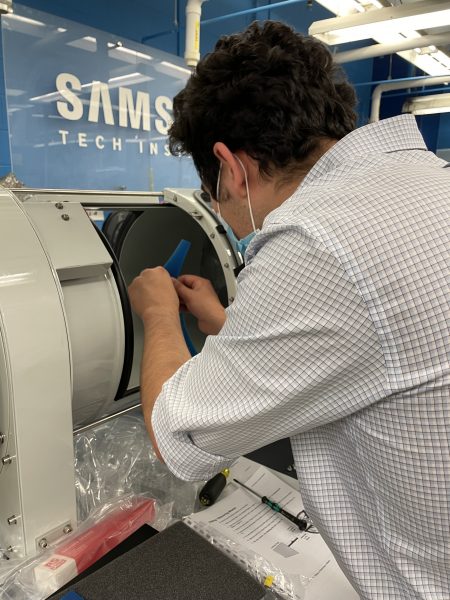
The assembly process was very simple and easy to follow from the provided instructions. Once the silencer is removed from its stowed position and fastened to the back of the apparatus, we connected the Control Cabinet to a power supply and opened the sliding door to attach the fins to the turbine. We then connected the apparatus to a laptop which was running the Versatile Data Acquisition System, or VDAS, which automatically collects data, calculates experiment parameters, and allows the user to create graphs and tables for the collected data. Once the fins were secured and the security door was closed and locked, we began to experiment with the fan speed, pitch, turbine speed, and anemometer. This data was also digitally displayed on the Control Cabinet.
Now that the apparatus was fully set up, we began to work through the first experiment to determine the influence of pitch angles and turbine speed on the coefficient of performance and power generated. As a future environmental engineer hoping to specialize in air hydrology, I was really grateful to be able to have a hands on experience with this kind of equipment. The option to switch out the included turbine fins for ones that have been 3D printed by students made the AE1005V even more interesting to use, with students being able to create and test different fin designs to determine optimal performance, and this really piqued my interest.
Eventually, I would like to spend more time using and learning about the AE1005V Wind Turbine Dynamics Apparatus, and other technology like it, and I am grateful that I had the opportunity to speak with the professors about what they plan to use theirs for throughout the upcoming fall semester.

 Extension: Vector Display
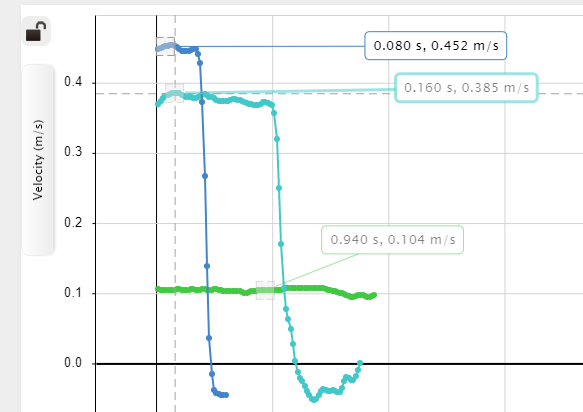
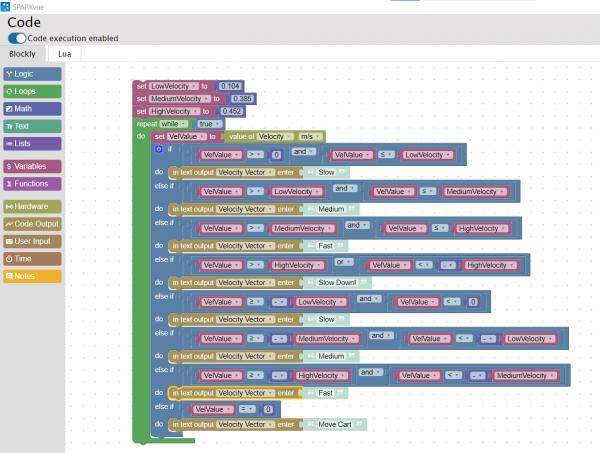 the ones I recorded, as shown in the image on the left. I tested my code by clicking start and moving the Smart Cart. At first, I was not sure where to look for the displayed text. I realized I had to change my display from a graph to digits. Then, by clicking the variable being displayed, I switched from Sensors to User-entered and chose Velocity Vector (the variable I created in the Blockly code). This time when I pressed start, the vectors I assigned to each velocity displayed on the screen depending on the Smart Cart’s speed. I decided to change the text displayed from vectors to words. As shown in the video below, I used simple terms such as slow, medium, and fast to describe the carts’ velocities.
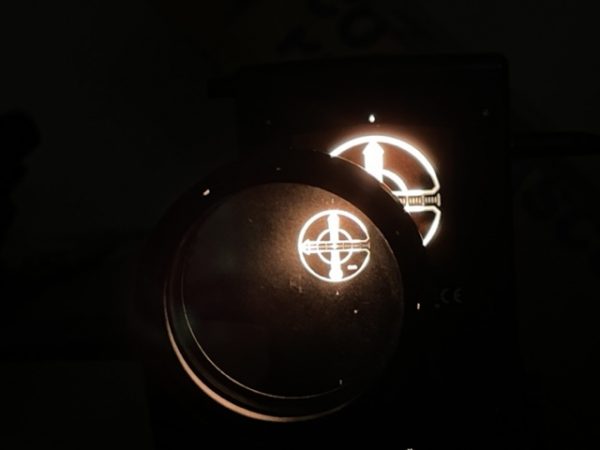
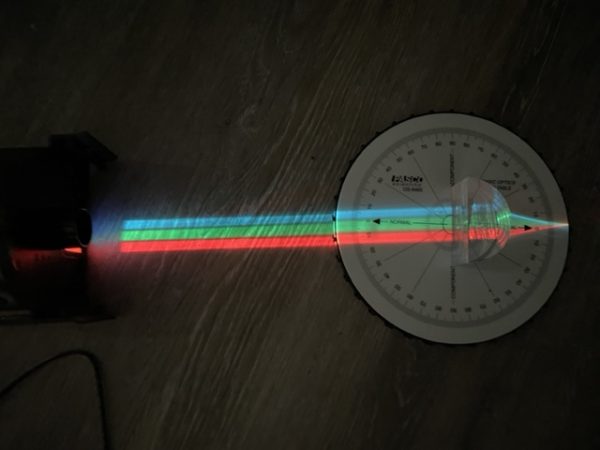 we used the Ray Table, the D-Shaped Lens, and the Light Source to perform a simple refraction experiment, using the PASCO Refraction lab as guidance as shown in the image on the left. This experiment was very easy to set up. All you need to do is plug in the Light Source and follow the instructions in the Refraction lab document. This experiment explores Snell’s Law, describing the relationship between angles of incidence and refraction.