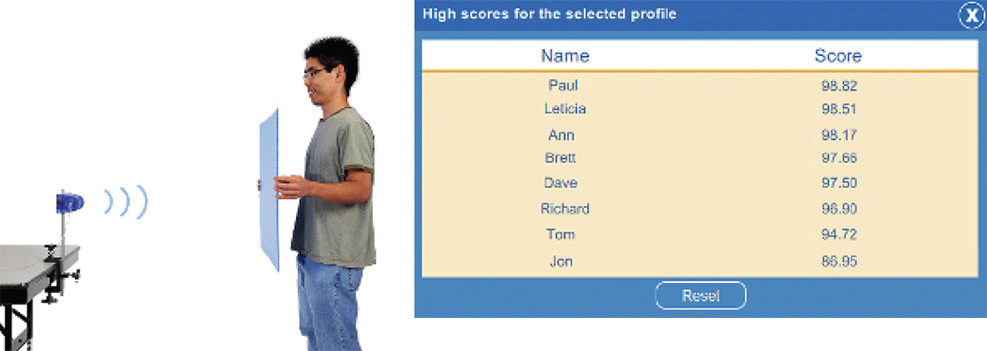
MatchGraph! Software
Download Free MatchGraph!™ Software
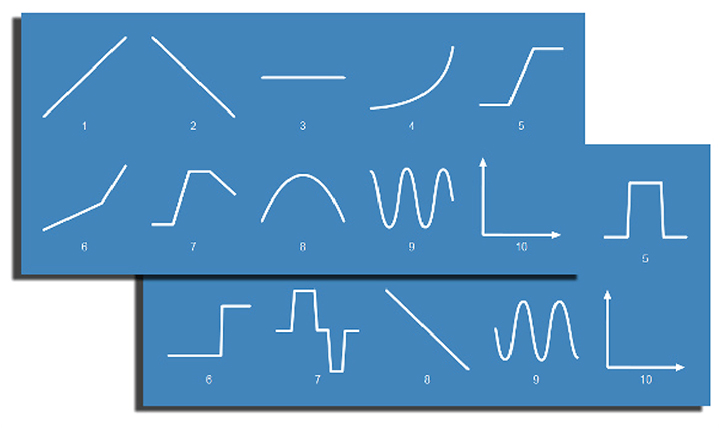
MatchGraph software is the most intuitive way to teach motion graphing. Engage your students with a kinesthetic experience that teaches graphing centered on motion. In MatchGraph, students attempt to match one of the nine provided graphs and are given a score showing how accurately they match their chosen curve. This activity gives them a deeper understanding of interpreting graphs as they see their own position and velocity graphed in real time.
When students use a PASCO Motion Sensor, they can create graphs of their own motion that they can then analyze. When they use a Smart Cart, students view real-time graphs of a cart they move.
MatchGraph is great for teaching:
- Fundamental graphing skills
- Basic concepts of position and velocity
- The concept of slope
- What it means when the slope is zero
- How position and velocity graphs relate to each other
MatchGraph is compatible with:
- PASCO Wireless Motion Sensor
- PASCO Wireless Smart Cart
- PASPORT Motion Sensor with a PASCO Interface
- ScienceWorkshop Motion Sensor with a PASCO Interface
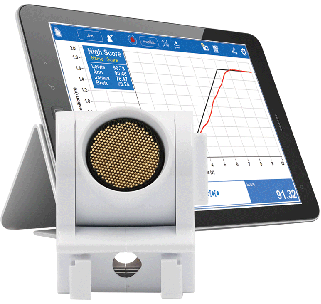
MatchGraph Screens
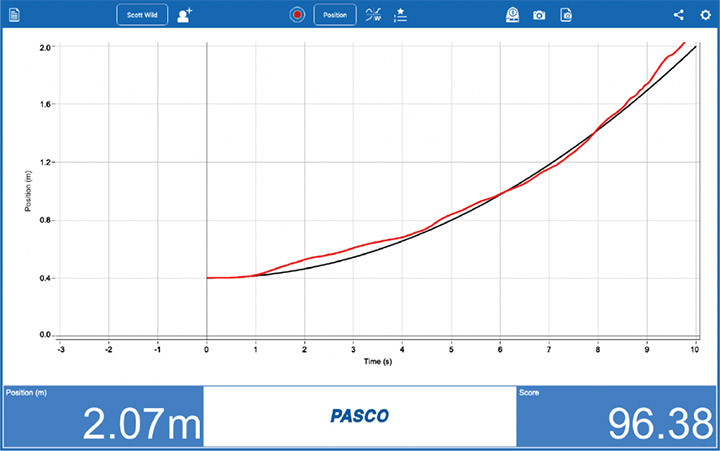
When students see their motion graphed in real time, it helps them quickly internalize and understand concepts around motion graphs.
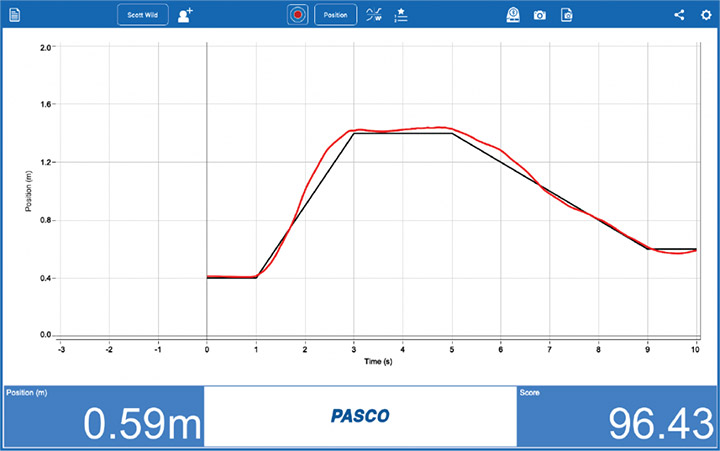
The relationships between position, velocity, and acceleration are easier to understand when presented visually and connected to motion.
The MatchGraph Toolbar
MatchGraph has an intuitive user interface that allows teachers and students to simply set up and begin matching immediately. You can add students, view high scores, export data, and more with a simple click or touch.

Toggle Between Position and Velocity
Students can choose from nine different position profiles and their derivative velocity curves. MatchGraph also allows students to collect position and velocity data freely, without using a MatchGraph profile.
Turn science learning into a class activity.
MatchGraph creates a fun and competitive way to let students experience the concepts of motion graphing as well as rate of change. Enter student names and keep track of individual scores for each curve. High scores are tracked for each individual MatchGraph profile.
