English Français

1-877-967-2726

Tag: STEM

Show Me The Money! Multiple strategies for funding your Wireless Sensor Purchase

It seems that many public schools are operating with science budgets that haven’t increased in over 20 years and are barely sufficient to purchase the consumable requirements for the year.   However, despite this wide spread apparent lack of funds many schools are still finding the means to make a significant investment in wireless sensor technology. When possible we ask our customers how their purchase is being funded. See below for a summary of the range of responses we’ve received. Regardless of the funding source, the following points are often incorporated in the successful grant proposals.

Wireless sensors:

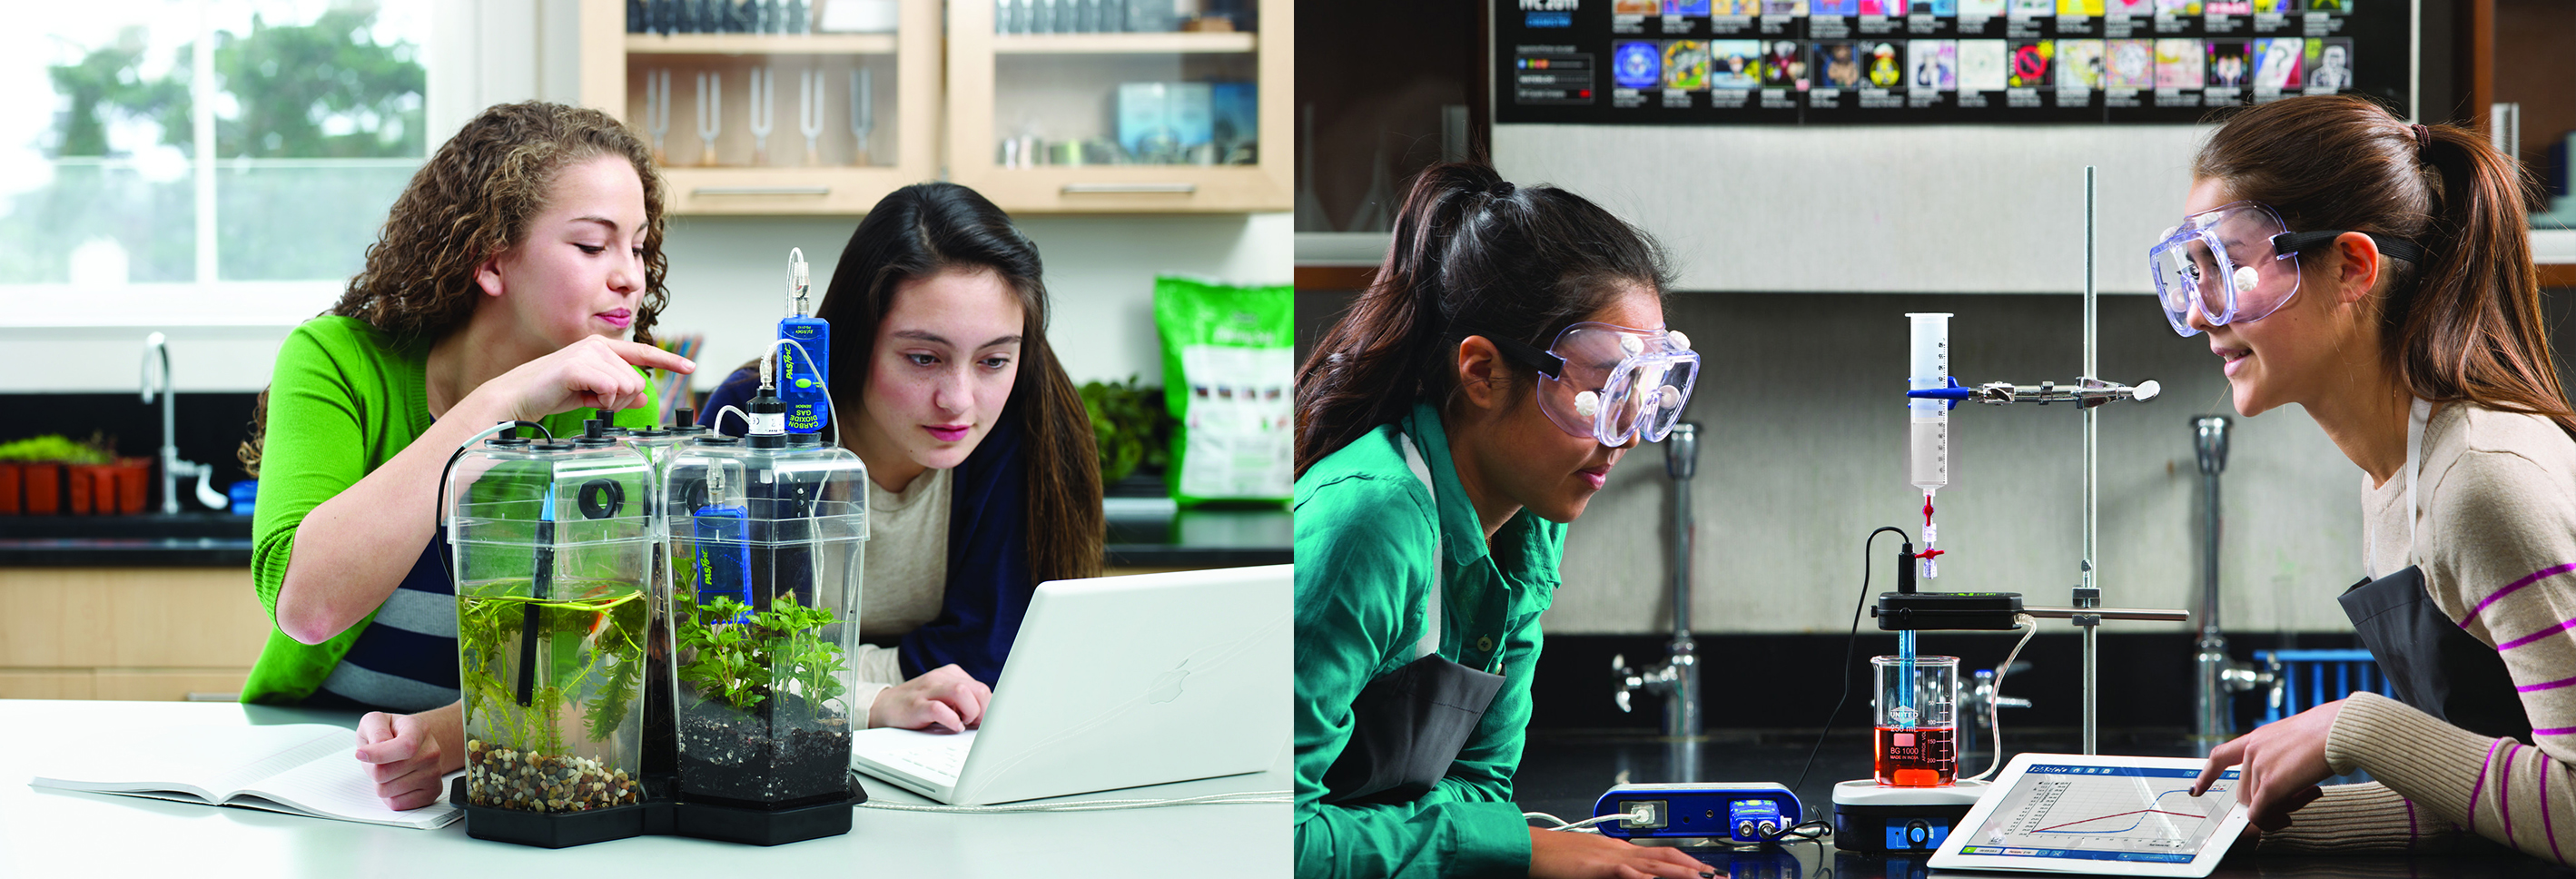
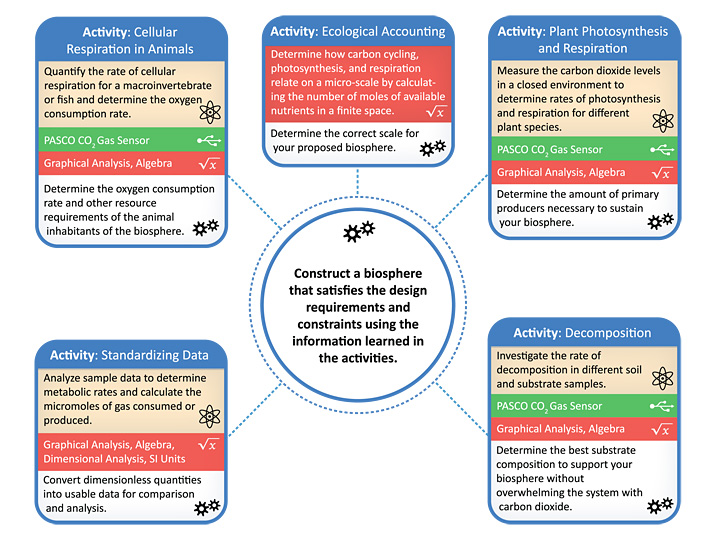
  • Support a STEM approach to teaching/learning
  • Are superb tools for Formative and Summative Assessment
  • Support Inquiry-based Learning
  • Are compatible with BOYD, iPad and Chromebook initiatives
  • Are extremely portable and can be easily shared throughout the school
  • Are very durable and may outlast your teaching career

Click here for a presentation on the educational arguments for wireless sensors:

Popular Funding Sources

  • Your Science Budget
    • You can purchase a probe ‘system’ for as little as $71 (the cost of a Wireless Temperature sensor). Wireless sensors are very affordable because no interface is required and the Sparkvue software can be downloaded at no charge. At these prices there is no need to wait for a windfall of new money to get started.
  • Your Principal
    • Most schools have discretionary funds that are controlled by their principals. With competing interests these funds can be challenging to access, however with the right pitch and supporting documentation you just might be able to sway some additional dollars in your science departments direction. Your principal will like the fact that probes can be easily shared, and that they support STEM approaches to learning.
  • Your Board’s Technology Funding Grants
    • We often get sizeable orders from schools that have received an internal grant from their board to fund a technology initiative. The orders sometimes accompany and an iPad or Chromebook purchase. Try reaching out to an instructional technology resource contact in your board to see what funding opportunities might be available.
  • New Schools
    • Those fortunate enough to be teaching in a school within the first few years of opening have the opportunity to get their science program started on the right foot. We have lots of experience in equipping new schools with sensors and would be very happy to assist you in compiling a list of instructional materials to support all areas of the science curriculum.
  • Corporate Advertised Grants
    • Many Corporations offer provincial and national grants to fund educational projects. To see some of the currently offered grants being offered check our grant and scholarship section of our website. These grant can be quite generous and are definitely worth checking out.
  • Non Advertised Corporate Grants
    • Corporations receive significant tax breaks and enjoy the good will which is generated when they fund educational initiatives. Although many larger companies have allocated budgets for grants and sponsorships, they’re not typically publicized. This is where following the credo ‘it never hurts to ask’ can really work to your school’s advantage. To start you might want to approach a close friend or relative whose company you feel may be good candidate.
  • Your Parent Council
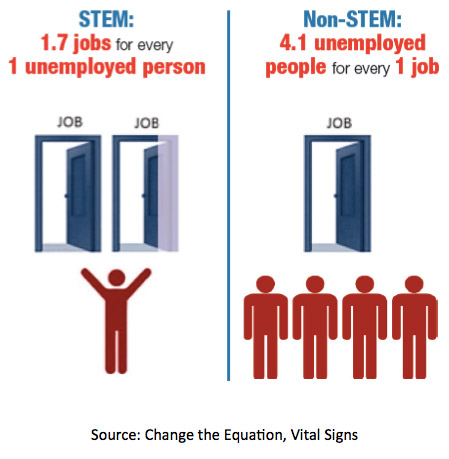
    • Parent councils love to fund the purchase of science probes. Councils take great pride in their schools and are easily persuaded of the potential for probes to make a tangible difference in their children’s education. Parents also recognize that career opportunities in STEM are more plentiful and financially rewarding than other paths and are keen to support technologies that make science more engaging.
      Be sure to share the ‘Imagine Wireless’ presentation with the council.


High School Science!

Wireless Temperature Sensor Classroom Experiment

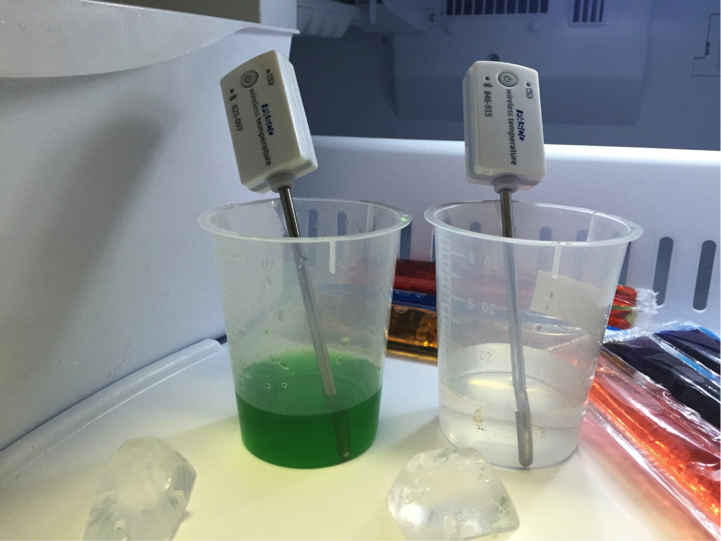
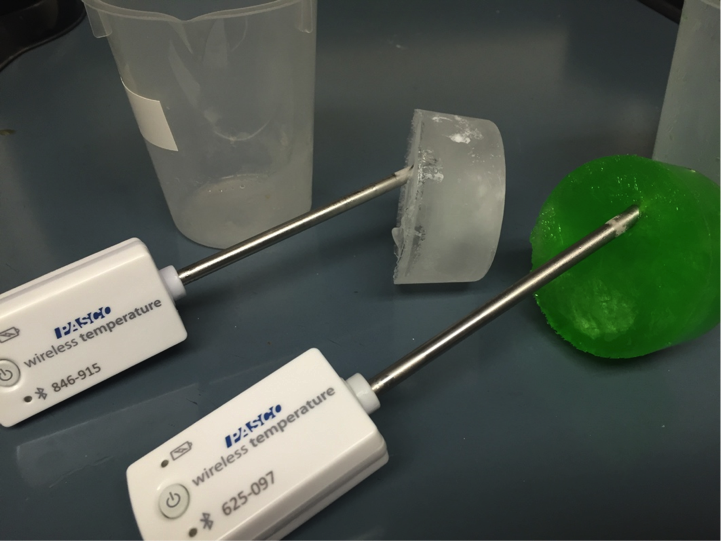
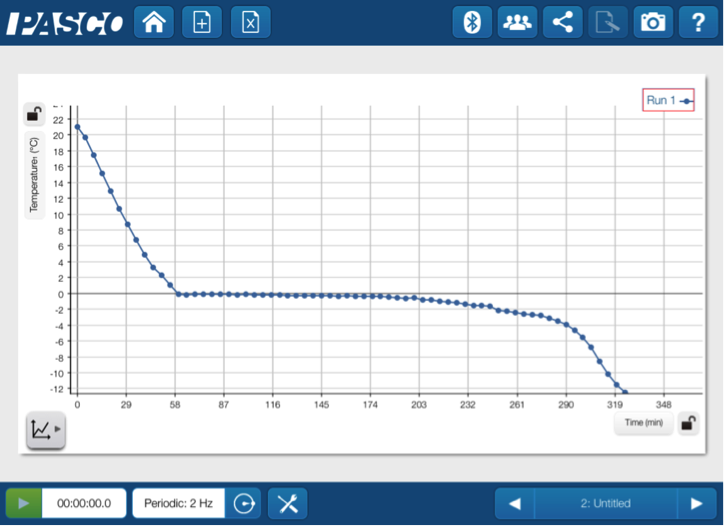
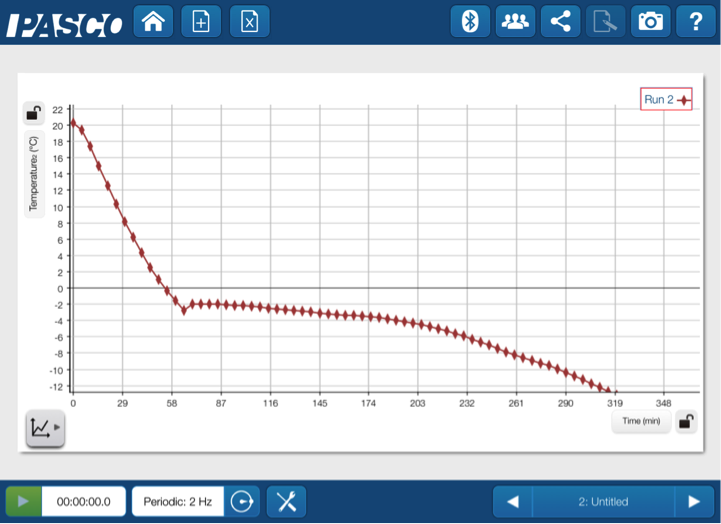
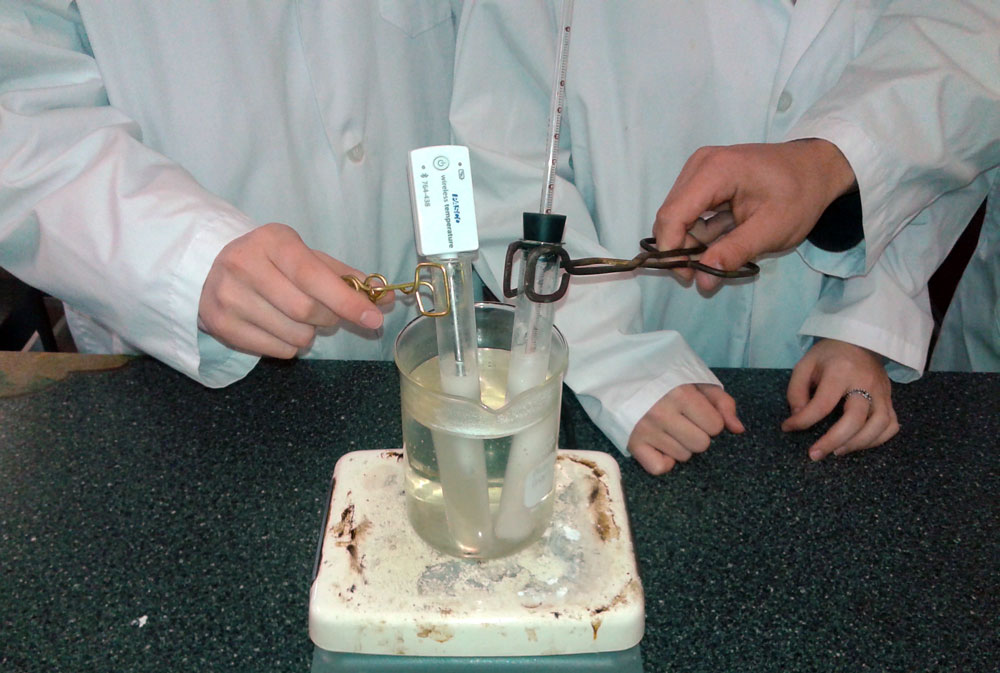
In this lab we melted wax in a test tube and measured the temperature as it cooled over 30 minutes.

The students were asked to draw a graph (cooling curves) of their results and were able to compare it with the more accurate data from the thermometer.

It was great to be able to show the students what their graphs should look like.

Tamara Manweiler
Maple Ridge Secondary School

Congratulations to the Science Fair Winners at Lambton-Kingsway Jr Middle School

Lambton-Kingsway School has enjoyed a long-standing tradition of community involvement and academic excellence, so it was no surprise to see so many family members turn out yesterday for the final judging of the Grade 6, 7 and 8 Science Fair.

As principal Kelly Caddel noted, this initiative started back in the fall, and it represents a significant commitment by students and teachers alike.

AYVA was happy to sponsor an award for each of the grade level winners who will be moving on to the Regional Competition.  We were pleased to see how enthusiastic Lambton’s students were about pursuing their STEM-related investigations… it was inquiry-based learning at its best!

Pictured above are just some of this year’s Science Fair Projects and junior scientists – all of whom were excited to articulate and showcase their findings.

Rethinking Science: Five Reasons Why Science Probes Are More Affordable Than Ever Before

Five Reasons Why Science Probes Are More Affordable Than Ever Before

  1. PASCO’s new range of wireless sensors do not require an interface to connect to a computer. Interfaces have traditionally ranged in price from several hundred to over a thousand dollars!
  2. PASCO now offers a free SPARKvue app that can be easily downloaded onto iPads, iPhones, Chromebooks and Android devices.
  3. Wireless sensors and the Sparkvue software require minimal training costs. The sensors are remarkably easy to use and the SPARKvue software is very intuitive. To help you get started AYVA and PASCO provide no charge, toll-free teacher support as well as a library of short instructional ‘How to’ videos.
  4. A wide range of free activities can be downloaded at no charge from the PASCO website. The growing list of available activities support all subjects and grade levels
  5. No need to buy designated computers. PASCO’s wireless sensors are also compatible with low cost tablets and Chromebooks (as well as students’ phones). The Sparkvue software provides the same functionality and experience on all platforms!

Did you know that the low cost, single channel wireless Airlink molds to your existing PASport sensors to make them wireless? This means you can enjoy many of the cost saving benefits of wireless sensors with your current inventory of ‘wired’ sensors.

Wireless Sensor Contest Winner

Stephen_Jacobs

Stephen Jacobs of St Francis Xavier Secondary School in Mississauga dropped by AYVA’s offices last Friday to pick up the class set of wireless temperature sensors that he won in our recent contest and to share with us some of the experiments in which he is going to use the sensors.

Please stay turned to our blog for a guest post by Stephen!

We are always looking for educators to contribute to our blog. If you have something to share please contact us here: /contact.html

The Reason for Seasons

Students often have the misconception that the distance from the sun is the main factor for the change in season. If that were the case, then the Northern and Southern Hemispheres would have the same seasons at the same time of the year, when in fact they are opposite.

Enlighten your students by modeling the movement of the Earth with some simple items. The setup pictured below includes a lamp to model the sun, a globe, a Wireless Light Sensor adhered to the globe with Velcro, and a meter stick to address those pesky misconceptions.

1

First we can look at the January in the Norther Hemisphere. Students should note the latitude and measure the light intensity using SPARKvue.

2

Then adhere the Wireless Light Sensor to the Southern Hemisphere at the same latitude as before, but well below the equator to measure the light intensity there.

3

The “brighter” students in the class will notice that tilt of the Earth has greatly affected the angle of the sensor relative to the lamp. Does the angle of incidence also affect the intensity of the light? The debate may be intense, but let students create a hypothesis before they collect data, then check the data to find out!

4

With the Earth is at this angle, there is a lot more light coming into the Southern Hemisphere. The amount of light that hits the an area on surface of the Earth is called insolation. The tilt of the Earth affects the solar insolation which is the reason we need insulation for the winter in the norther hemisphere while the Southern Hemisphere experiences summer. For students who assumed the seasons were based on the distance from the sun, this is truly a light bulb moment!

What is happening when the Earth is half-way around its orbit? No need to wait six months, we can fast forward to July simply by moving the globe to the other side of the lamp. Use the meter stick to make sure the globe is equidistant from the “sun” and affix the Wireless Light Sensor to the Northern Hemisphere.

5

The tit of the Earth hasn’t changed, but now the Northern Hemisphere is pointing more directly toward the lamp. Next we can move the sensor to the southern hemisphere to see if it is still as dazzling as before.

6

We can illuminate the effect by once again checking the data.

7

The light intensities have flipped from the previous run as the angle of incidence has changed. Now the Northern Hemisphere basks in the sun, while the Southern Hemisphere needs some insulation due to a lack of insolation.

Using SPARKvue software we can get a year in review by comparing the data.

8

Throughout this brilliant activity, student should see that the amount of light hitting the Earth’s surface at different parts of the year is based on the tilt of the Earth about its axis, not the distance from the sun. Hopefully, this activity has shed some light on the true reason for the seasons.

Concentrate on the Conductivity

Students have a hard time concentrating when the topic is solution concentration. The solution may be having them create their own solutions.

Using some solid solutes and glassware, have them make a solution with a specific molarity. They should write down their own steps and follow their procedure. Make sure they are specific with the type of glassware and the quantities of solute and solvent. This is a good way for them to review items or steps that they may have forgotten and to put theory into practice.

Have them make two solutions of the same molarity: one from an ionic solute and the other from a covalent solute. After revising their procedure and correctly massing their solutes, you can take stock of their work, while they create stock solutions. Add a splash of food coloring to each solution to help them distinguish between the two. There is a good pedagogical reason, and an added bonus that a dash of color makes any activity more festive!

After making up their stock solutions from the solid solutes, they can concentrate on the concentration even more by making dilute solutions. They should create a series of dilutions that are the same volume. Before they start pouring, make sure they understand mole and volume relationships by have them write out their calculations and procedures.

Those drops of food dye will really come in handy as they prepare the solutions because they’ll serve as a visual check on the concentration! They can see that the solution is getting more dilute, and you can quickly see if they are on the right track.

Now it’s time to kick this solution investigation up a notch. They can measure the conductivity of the solutions using SPARKvue and the Wireless Conductivity Sensor.

3

First have them test the solutions with the ionic compound solute. As they collect the data, they should plot Conductivity vs. Concentration.

4

There are a couple of key concepts that they can quickly discern from this graph. The solutions containing the ionic compound are definitely electrolytic (they conduct electricity), and the conductivity is directly related to the concentration.

What happens with the covalent compound solutions? Will they see the same relationship?

5

There is a straight line on the graph for the covalent compound— it just happens to be flat and approximately zero for all the concentrations!  Even though they could see from the dyes that the solutions were different, the conductivity did not change. But why? These solutions are non-electrolytic. No matter how high or low the concentration, the conductivity will not be affected.

Through this activity, students get to concentrate on concentration by making and testing their own solutions. The food coloring and the Wireless Conductivity Sensor provide visual cues and quantitative data as the students construct their own cognitive concentration concepts (say that five times fast). Even a measurement of zero can be important because, in this case, it can drive home the important difference between electrolytes and non-electrolytes.

Under Pressure – Wireless sensor inside a balloon!

When introducing pressure and gas laws, I have always used balloons as a conceptual starting point because they are a familiar item to students. Unfortunately, I could not easily measure the actual pressure inside of the balloon— until now. The Wireless Pressure sensor make this possible and very easy.  Pretty amazing right?  What’s next, life on mars?

pb1

Even for those that are absolute beginners to pressure studies, this is a fun experiment, one that’s sure to garner you great fame among your students. Using a slightly larger balloon, and a little patience, the students who are able to get the pressure sensor into the balloon will definitely be heroes (if just for one day)

Now, with the sensor secured inside the balloon, let’s dance— or at least begin the experiment. Turn the sensor on and connect it to your device so your students can commence a countdown and start collecting data while they inflate the balloon!

pb2

The analysis tools in SPARKvue, allow the students to observe the pressure ch-ch-changes over time.

pb3

Some things to initially note could be the slight increase in pressure as the balloon is inflated, the changes in pressure as the balloon is compressed and the sharp decrease in pressure as when the balloon is popped. It’s a fantastic voyage through the many phases of the pressure change.  Seeing data displayed in real time helps connect the science behind the sound and vision of a balloon popping.

Now that they have been engaged by the activities and explored the data (and before they start to act like a rebel, rebel) try having the students explain and elaborate on what is happening and why.

With this activity only taking a few minutes to complete it can be used as a demo, as a quick investigation or it can be grouped with a few other basic investigations where students move station to station to learn about gases. And as students begin to construct their knowledge about gas properties using familiar items, you can incorporate the empirical gas laws leading up to the ideal gas law.

To make this a truly memorable lesson, you and your students should be listening to “Under Pressure” by Queen and David Bowie while performing the activity.   All the young dudes (and dudettes) will enjoy this one.


Engaging STEM (STEAM) Activities for Girls

Exposure to opportunities for learning

It is important to expose young girls to STEM fields so that they are more likely to embrace science and math when they reach high school. Science and technology are and will continue to be important factors in what we are able to accomplish in our lifetimes.

stem_girls

Addressing a real-world problem and challenging students to use science, technology, engineering and math to solve it can encourage young girls to maintain their interest in STEM fields. Innovative inquiry-based, technology infused STEM.

PASCO has 4 STEM Modules including:

  • Air Bag
  • Biosphere
  • Egg Drop
  • Collisions

These STEM Modules are all available for free download in the PASCO Digital Library under the STEM tag.

Each of these discreet modules challenges students to combine Science, Technology, Engineering and Math concepts in pursuit of a solution to a particular challenge.

HS STEM Biosphere Module catalog

Being an information-rich society, students should be encouraged to explore the numerous websites of professional organizations such as the The Scouting Life, Society of Women Engineers, Women in Technology International, Association for Women in Mathematics and Association of Women in Science, to name just a few. These resources present a tremendous opportunity to learn a great deal about the field, about what it’s like to be a woman in a specific STEM profession, about career opportunities etc.

stemjobsindemand


Popsicle Phase Change

Phase changes are an important part of chemistry and physical science curriculum — and Freeze Pops are an important part of everyone’s summer. What better way to take the edge off the summer heat than combining the two to make a cool activity that addresses changing states of matter?

In the science lab, temperature measurements will help crystalize students’ thoughts around freezing and connect the phase change with particle motion.

asset_upload_file986_192113

To set up this cool experiment, you’ll need to get a base line temperature change of pure water as well as the temperature change of the Freeze Pop. First, pour some water into a plastic container and add a Wireless Temperature Sensor. Next, we’ll open two Freeze Pops (that haven’t been frozen), pour the contents into another plastic container and add a second Wireless Temperature Sensor. Now you can use SPARKvue’s remote logging capabilities and put everything in the freezer. And if you really want to sweeten the inquiry, add some additional Freeze Pops as a tasty post-experiment treat!

The Wireless Temperature Sensor can remotely log data for days, but we’ll only needed a few hours. After letting the samples set overnight, it was time to check the results.

asset_upload_file155_192113

The samples look frozen. Let’s check SPARKvue to see if the data is just as solid.

asset_upload_file928_192113

I started by checking out the water. No brain freeze here— that’s just cool data.

The students will notice that the temperature dropped to 0oC, and stayed there before dropping again to the temperature of the freezer. But what’s so special about 0oC and why the plateau?

The students may know that this is the freezing point of water. But they may not realize that the water sample can’t get below the freezing point until the entire sample is frozen. This is where particle illustrations become important.

asset_upload_file289_192113

As the water molecules cool, they slow down into a regularly repeating pattern forming a solid. But why the plateau? As long as there are some faster, freely-moving water molecules in the sample, there will be an equilibrium between the liquid water and the ice keeping the temperature constant. Once all of the water molecules are moving slow enough to be frozen and in the solid state, then the temperature can begin to drop again.

asset_upload_file797_192113

Is the same thing happening with the Freeze Pop? It’s a good thing we have hours worth of data to find out!

This sample, which is not pure water, froze at a temperature that is lower than zero. The freezing point is depressed— but you shouldn’t be. This always happens with a solution. The other particles in the sample (sugar and dyes mostly) get in the way of the solid-liquid water equilibrium and lower the Freeze Pop freezing point.

Students may also note that there is not a flat plateau during freezing. As the water freezes out, the sample gets more concentrated with the “other” particles, depressing the freezing point even more. The freezing slope isn’t steep enough for sledding, but it is definitely noticeable. Once the entire sample is frozen, the temperature decrease is more dramatic.

The concept of freezing point depression is important and it has real practical applications— from making Freeze Pops and ice cream, to car antifreeze and melting ice in the winter.

Now your students can not only understand freezing, but they can explore factors that would affect freezing point depression. I am sure this would open up the lab to 31 flavors of ice cream inquiry!

Save & Share Cart
Your Shopping Cart will be saved and you'll be given a link. You, or anyone with the link, can use it to retrieve your Cart at any time.
Back Save & Share Cart
Your Shopping Cart will be saved with Product pictures and information, and Cart Totals. Then send it to yourself, or a friend, with a link to retrieve it at any time.
Your cart email sent successfully :)