English Français

1-877-967-2726

Month: April 2021

The Beauty of Periodic Motion: A Capstone Observation Experiment

As a third-year Biomedical Engineering student at the University of Guelph, learning throughout this pandemic has been especially difficult, but why? It’s all the same materials. The same teaching style. I can even choose my learning environment and mitigate distractions.

For me, the biggest thing that has been missing throughout this pandemic has been experimentation, but more specifically, labs that push students to apply their knowledge to their own observations or to the world around them. During this pandemic, I took a course called Biomechanics as an extracurricular. Without a doubt in my mind, this course ignited my passion for practical application. Students were required to observe, collect, and write three different labs, all centered around the biomechanics of crutch walking. After learning to use a goniometer, force plate, EMG sensors, and 3D modelling software, students then created their own biomechanics experiment.

This is where the real learning begins.

What does this have anything to do with harmonics or even Capstone, you may ask? The point I am trying to make is that you can throw complicated laws and theorems a student’s way. However, they won’t understand it until they begin to connect these laws to the world around them. Every student has asked, “When will I ever use this?” but rarely do you ever find a student who seeks the question “How does this affect the world around me?” As such, I wanted to pose a simple question that pushes students to connect their knowledge outside the classroom.

What are some examples of harmonic motion in your daily life?

This question is really nothing special, but it can be easily observed and analyzed with little to no equipment. For this example, I used PASCO’s Capstone Software going frame by frame to analyze the motion of various objects and graphing the vertical position (meters) versus time (seconds).

The first example of harmonic motion was the spinning of a bicycle wheel, which was suspended to have no contact with other objects. Three different examples of periodic rotation were observed using the Capstone software and a bright green piece of tape.
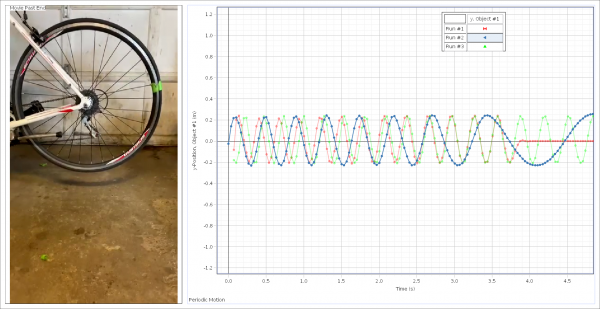
The green line represents a graph that has no brakes applied, the blue line represents a system with light braking pressure, and the red line represents a system with full braking.

From the data collected, it was observed that as the brake pressure is increased, the period of the oscillator decreased. This trend is essential for students to understand as it raises the question of braking distance and the effects of friction on a periodic oscillator.

The next example of harmonic motion was car suspension. The system represents a driven harmonic oscillator as most car suspensions will be critically damped or have some sort of dampening. For this experiment, I highly recommend filming the oscillation in real-time with an additional light source. The top of the spring was tracked throughout the cycle and plotted on a vertical position vs. time graph.
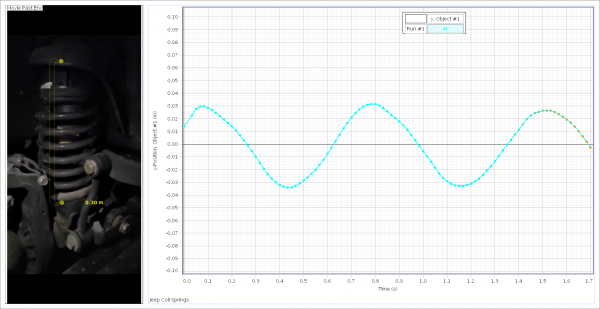
The blue line represents the effect of the applied force on the vertical position (meters) of the spring vs. time (seconds).

As a final example of harmonic motion, the E-String of a guitar was filmed using the slow-motion setting on a phone, shooting at about 960 fps. String harmonics are incredibly difficult to capture, and for a more accurate measurement, I highly recommend the use of a slow-motion camera. As an alternate example of harmonic motion, I recommend a swing, metronome, or any pendulum clock.
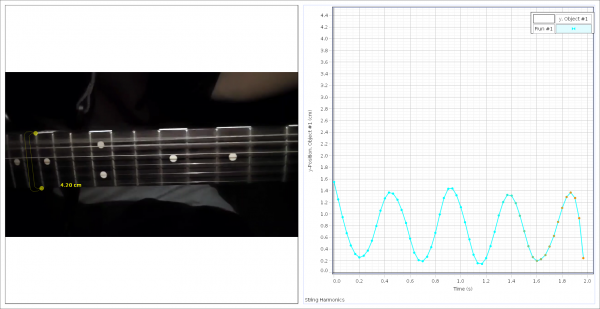
This graph represents the vertical position (centimeters) of the guitar string vs. time (s).

Laboratory experimentation is usually very equipment-heavy, which prevents students from observing the effects of the laws and theorems on a day-to-day basis. The difficulty of tracking time, position, or other factors removes focus from the real learning and can often times impede a student’s understanding. The best way to foster a student’s understanding is through their own curiosity.

An Experiment Across Canada: How to Connect With Students Through Online Learning

Do you remember when in class teaching was considered standard, and a 6-feet social distance rule was not in place? A time before Zoom lectures were the new normal, and hands-on learning was encouraged in the classroom? With socially distant, hybrid, or virtual learning becoming a routine for teachers and students, it’s important that we find ways to incorporate student engagement in STEM courses.

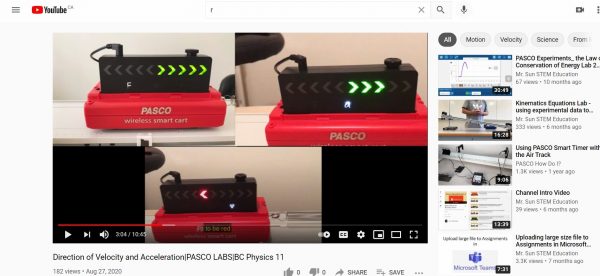
I am a second year Environmental Sciences student at the University of Guelph currently in the Co-operative Education stream. I had the great opportunity to work for AYVA Educational Solutions for my first work term. As 2021 continued, I began to wonder, what would the effects of Covid-19 be on student involvement in STEM education? It was at this time, that I paired up with Ross Sun, a high-school teacher in the province of British Columbia. Ross is a great believer of hands-on learning techniques being accessible to students, even from remote settings. He has a YouTube page called ‘Mr. Sun STEM Education’ that focuses on providing virtual material for his students, with many of his videos including PASCO equipment such as the Smart Cart Dynamics System.

“Hands on learning in the modern society (especially right now) not only refers to making things by hands but also using technology. In fact, during this pandemic time when we try to limit traditional hands on activity/lab, using technology becomes the #1 alternative […] And that includes but not limited to virtual labs, video analysis, programming, making videos, and the use of sensors which can output data to be shared such as PASCO sensors.”               – Ross Sun

In order to investigate ways that teachers and students can interact virtually, while still maintaining high levels of curiosity and investigation in the classroom, the two of us were able to conduct a three-day long experiment using PASCO wireless weather sensors.

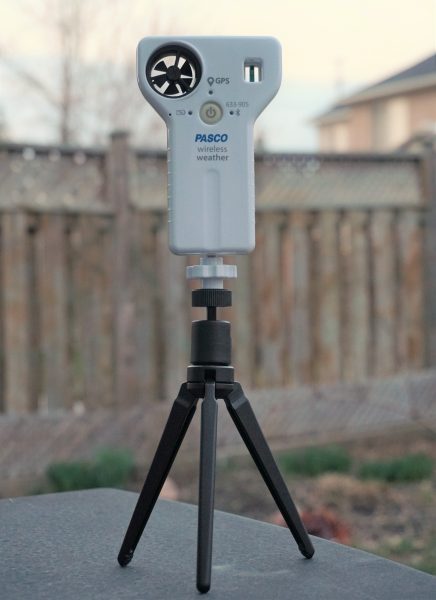
The weather sensor is an all-in-one device for monitoring environmental conditions and has the ability to measure over 17 different factors simultaneously, including temperature, humidity, light, and pressure. Being an environmental student, this sensor was perfect for the type of experiment we were hoping to conduct. The two of us were able to create a project that would analyze and compare the weather in Ontario and British Columbia. Over the course of 72 hours, starting on March 30th and going until April 1st, two weather sensors tracked and calculated the temperature and relative humidity in both locations. The free SPARKvue app available to mobile devices was able to connect with the sensor to begin logging. PASCO’s remote logging option was a great feature to use because once the sensor was connected, you could take your phone anywhere without it disrupting the sensor from recording data. This made the experiment extremely easy to complete without constantly monitoring the device.

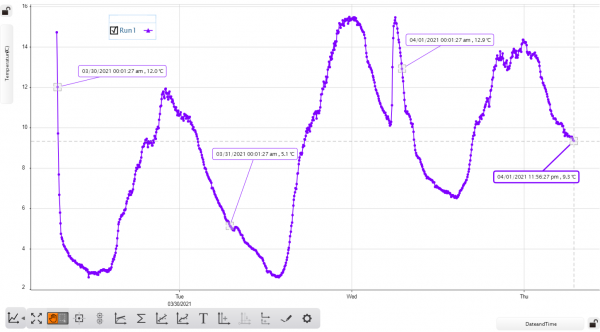
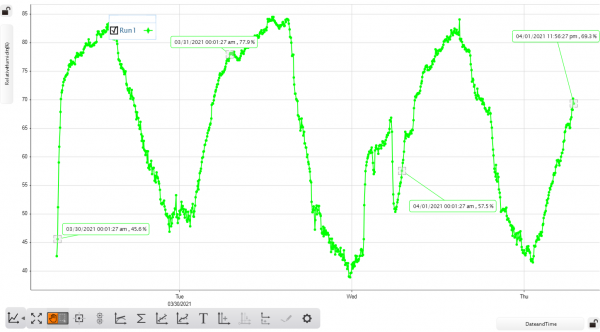
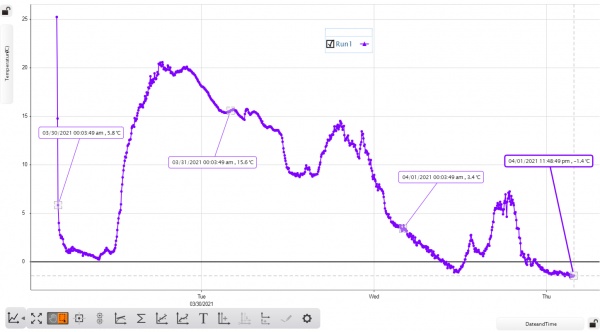
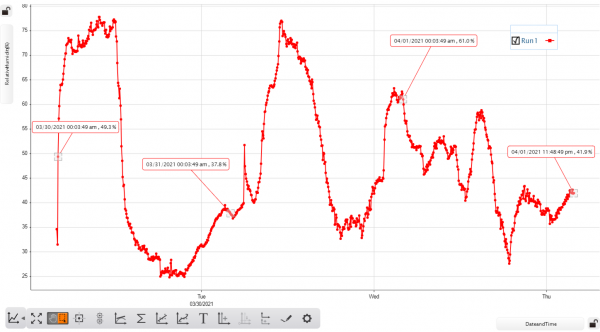
Both sets of data were then downloaded to the SPARKvue desktop software where weather trends were compiled into graphs. The mentioned graphs can be seen below where it is very noticeable that the particular region in British Columbia, where this investigation was conducted, contains stable waves of increasing and decreasing temperature and relative humidity. In contrast to this, the temperature and relative humidity recorded for Southern Ontario is much more sporadic with a less consistent pattern.

The graphs above show the recorded data sets for relative humidity (right) and temperature (left) for the east coast of British Columbia. The trend shows large changes in temperature of the 72 hour period with consistent waves being formed. The first recorded data set for each day is represented by a connecting box with the date and time.

The graph above shows the recorded data sets for relative humidity (right) and temperature (left) in Southern Ontario. In contrast to the data recorded for BC, there is no clear pattern of increases and decreases in temperature and relative humidity. The temperature is on an overall trend downward with sudden small changes throughout the days. The relative humidity shows several irregularities and spikes throughout Thursday. The first recorded data set for each day is represented by a connecting box with the date and time.

This experiment is an example of how easy it is to combine inquiry-based and hands on learning with remote teaching practices. Using the SPARKvue Shared Sessions, teachers and students can collaborate online with real-time data, where each student has the ability to manipulate and examine the data collected.

Exploration and curiosity is one of the most important elements for students advancing through the secondary school level. This crucial time is when many students consider their professional careers beyond high school, and make informed decisions on the type of post-secondary path they want to follow. The PASCO wireless sensors are an excellent option for providing students with the freedom to explore backgrounds in STEM, even from the safety of their own homes.

Resources:

Wireless Weather Sensor

Save & Share Cart
Your Shopping Cart will be saved and you'll be given a link. You, or anyone with the link, can use it to retrieve your Cart at any time.
Back Save & Share Cart
Your Shopping Cart will be saved with Product pictures and information, and Cart Totals. Then send it to yourself, or a friend, with a link to retrieve it at any time.
Your cart email sent successfully :)