English Français

1-877-967-2726

Tag: High School

Five Demonstrations That Show Why Physics Is So Cool!

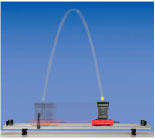
1. Shoot the target. Load, Aim, Fire!

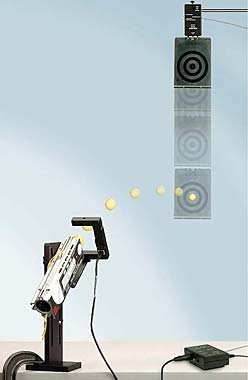
Your students will ask you to repeat this demo over-and-over again. The suspense of waiting for the target-to-drop and for the gun-to-shoot will mesmerize your students. At the instant the projectile is shot from the launcher the target is dropped. The ball will consistently hit the bull’s-eye of the falling target as both objects accelerate downwards at the same rate.
Shoot-the-Target System ME-6853 ($604)

2. Ballistic Cart Accessory. Warning: may cause cognitive dissonance

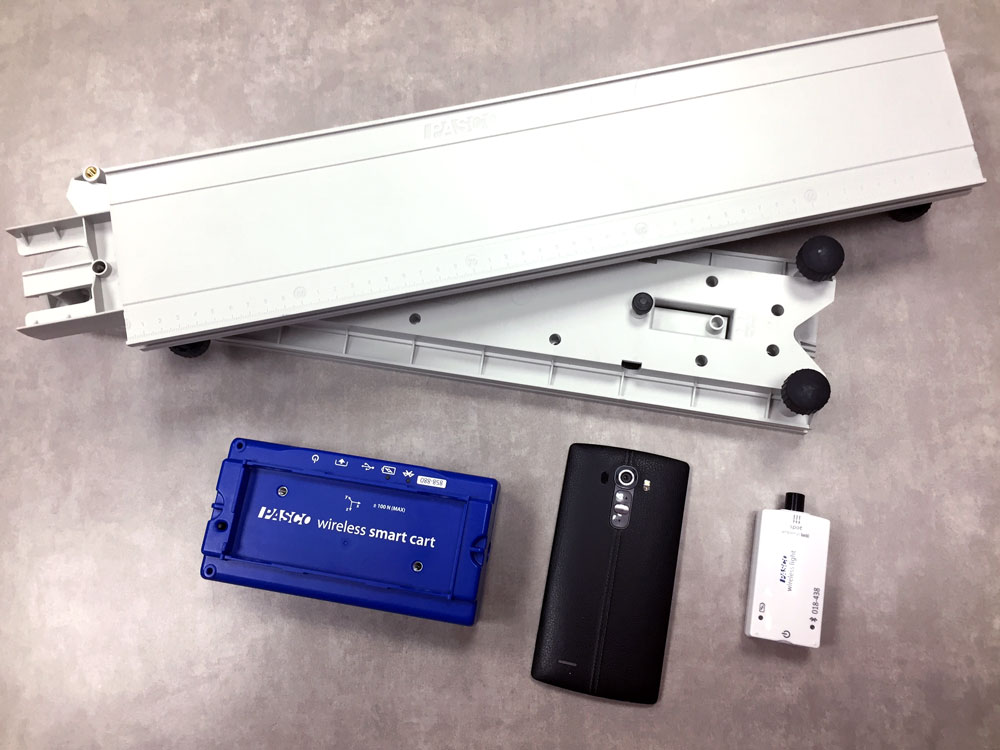
Your students may not believe their eyes, but hopefully they’ll believe the physics. The moving cart will reliably catch the vertically launched ball every time regardless of the cart’s speed. This accessory works with your dynamics track system and is a great demonstration to show the independence of x and y motion.
Ballistic Cart Accessory: ME-9486 ($756)

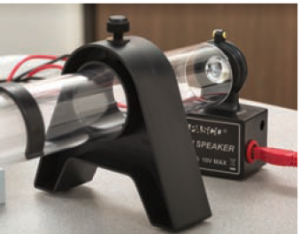
3. Standing Waves. Strobe lighting is not just for rock concerts.

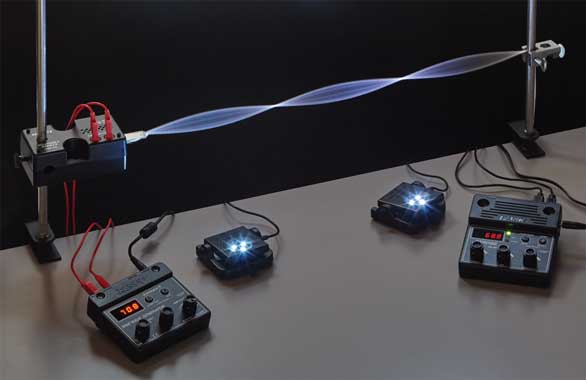
Dim the lights and let the show begin. Just like at the rock concerts, strobe lighting highlights the object of interest. The strobe also slows down the motion of the vibrating string so that students can see the features of the standing wave in greater detail. The Frequency and light intensity can be precisely adjusted for superior results.
String Vibrator: WA-9857 ($142)
Sine Wave Generator: WA-9867 ($511)
Strobe: ME-6978 ($681)

4. Magnetic Demonstration System. May the force be with you!

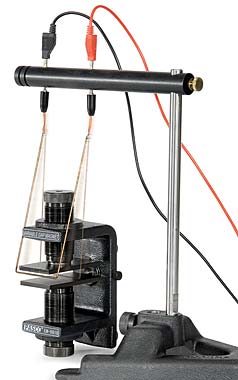
When raised and then released the swinging solid paddle stops instantly between the gap of the Variable Gap Magnet while the slotted panel sails straight through with no issue. Both paddles are made of aluminum, so why the difference? The answer …Magnetic Dampening! Diamagnetism and Paramagnetism, and Force on a Current Carrying Wire – are other great demonstrations of this comprehensive system.
Magnetic Demonstration System: EM-8644B ($812)

5. Ring Launcher. 10, 9, 8, 7…. 1, All Systems GO!

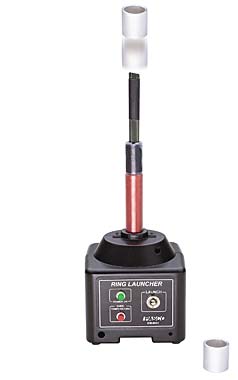
The ‘launched’ ring may not make it to the moon, but it will fly an impressive 2 meters straight up. The projectile is propelled by the Lorentz Force that arises from the interaction between the alternating magnetic field of the coil and the current induced in the ring. The Ring Launcher is a classic demonstration that includes 5 rings of different metals and dimensions.
Ring Launcher: EM-8817: ($1077)

Inverse Square Law

Rick Debenedetti from Streetsville Secondary School in Mississauga demonstrates how to use a Smartphone, a Smart Cart and a Wireless Light Sensor to investigate the relationship between light intensity and the distance from a single point source of light.

Materials Used

PAStrack (ME-6960) $172
Wireless Light Sensor (PS-3213) $141
Wireless Smart Cart (ME-1241) $325
Smart Phone with Flashlight App

Assembly

  1. Place the light sensor on the Smart Cart with the Spot light sensors facing forward (opposite end of the plunger)
  2. Align the light sensor to the Smartphone’s flashlight as shown in the picture. To get the proper height raise the track using the adjustable legs of the PASTrack.
  3. Using the PASTracks built-in scale position the base of the Spot Light sensor 20 cm from the Smart Phones Flashlight.

Software Setup

  1. Within the SPARKvue software Connect Wirelessly to both the Light Sensor and Smart Cart.
  2. Open the SPARKlab file ‘Inverse Square Law’ file which plots Light Intensity against Position with a 20 cm offset.

Collecting Data

  1. One person should be controlling the Smart Cart and Smartphone and another controlling the software
  2. Turn the Smartphone’s Flashlight on
  3. Click on the SPARKvue ‘Play’ button
  4. Slowly roll the Smart cart away from the Smartphone at a steady pace. The light sensor is only sampling at 2 HZ so moving too quickly will result in too few plotted data points. The Smart Carts position sensor will accurately record the distance that the Smart Cart travels
  5. Once the cart reaches near the end of the track stop the recording of data

Analyzing Results

  1. From the Tool box bar select the tool box icon to expand the bar
  2. From the expanded tool box select the ‘Scale to fit’ icon
  3. Next click on the ‘Curve to Fit’ icon and select the ‘Inverse Square Fit’ menu option

The Blue Line shows the connected data points of the light sensor readings plotted against the Smart Carts position sensor readings. The red line is the applied Inverse Square Fit. Notice how well the Inverse Square Fit curve matches the plotted data.

Rethinking Science: Five Reasons Why Science Probes Are More Affordable Than Ever Before

Five Reasons Why Science Probes Are More Affordable Than Ever Before

  1. PASCO’s new range of wireless sensors do not require an interface to connect to a computer. Interfaces have traditionally ranged in price from several hundred to over a thousand dollars!
  2. PASCO now offers a free SPARKvue app that can be easily downloaded onto iPads, iPhones, Chromebooks and Android devices.
  3. Wireless sensors and the Sparkvue software require minimal training costs. The sensors are remarkably easy to use and the SPARKvue software is very intuitive. To help you get started AYVA and PASCO provide no charge, toll-free teacher support as well as a library of short instructional ‘How to’ videos.
  4. A wide range of free activities can be downloaded at no charge from the PASCO website. The growing list of available activities support all subjects and grade levels
  5. No need to buy designated computers. PASCO’s wireless sensors are also compatible with low cost tablets and Chromebooks (as well as students’ phones). The Sparkvue software provides the same functionality and experience on all platforms!

Did you know that the low cost, single channel wireless Airlink molds to your existing PASport sensors to make them wireless? This means you can enjoy many of the cost saving benefits of wireless sensors with your current inventory of ‘wired’ sensors.

High-Impact, Low-Cost Demos: 5 Demos under $500

Bicycle Gyroscope

Conservation of angular momentum.
Your students will literally become part of the demonstration. Featuring cushioned handgrips, a pull cord with handle, and weighing only 6 pounds, the Gyroscope is very to use. Can be used with any rotatable office chair; however, for best performance it’s best to also get the PASCO Rotating Chair and Gyroscope Mass Set.

Compression Igniter

Untitled-1

Catching Fire!
This demonstration is guaranteed to impress your students. By quickly pressing the piston down, the tightly sealed chamber will experience an increase in pressure and temperature well beyond the point to ignite a piece of paper.

Resonance Air Column with Speaker

resonance_air_column

This demo will definitely ‘resonate’ with your students.
This low cost resonance tube works remarkably well. The molded piston head reflects sounds very efficiently and when positioned at a node will produce a very loud resonance

Use with the supplied speaker or a tuning fork
8 Adjustable rings to mark nodes
Can be used with or without a sound sensor

Thermoelectric Converter

thermo_electric_converter

Demonstrate the first law of Thermodynamics.
Your students should know that you can heat water with electricity, but will be amazed to learn that you can use hot water to produce electrical energy. The Converter extracts electrical energy through a temperature differential by having one of its legs placed in a cup of cold water and the other leg in cup of hot water.

A series of semiconductor thermoelectric cells convert thermal energy into electrical energy
The process can be reversed by passing a current through the converter

Rotational Inertia Set

rotational_inertia_set

Rock and Roll! Compare rotational inertias with spheres and balls of different radius.
Your students will discover that the speed on an object rolling down a ramp is determined by the shape and distribution of its mass. They’ll be surprised to discover that the mass of the object and its radius does not affect the outcome.

Wireless Sensor Contest Winner

Stephen_Jacobs

Stephen Jacobs of St Francis Xavier Secondary School in Mississauga dropped by AYVA’s offices last Friday to pick up the class set of wireless temperature sensors that he won in our recent contest and to share with us some of the experiments in which he is going to use the sensors.

Please stay turned to our blog for a guest post by Stephen!

We are always looking for educators to contribute to our blog. If you have something to share please contact us here: /contact.html

Augmented Education – Bringing Real and Virtual Learning Together

Are you an educator who wants to use new technologies in their classroom to inspire, motivate and engage students? If yes, we would like to introduce a must read book for you: Augmented Education – Bringing Real and Virtual Learning Together by Kieron Sheehy, Rebecca Ferguson and Gill Clough.

Technology is rapidly developing and is changing the world as we know it. Teachers are now excited by the implications of new technology to create better learning experiences and transform learning contexts. Augmented Education is based on research and interviews with practitioners. From primary school to higher education, the book presents practical examples for educators on new uses, conceptions and developments of learning.

The book defines augmented learning as ‘use of electronic devices to extend learner’s interaction with and perception of their current environment to include and bring to life different times, spaces, characters and possibilities’. The authors look deep into augmenting learning in the “real world” by use of “virtual technology” and, vice versa, using the “physical world” to augment learning in “virtual environments”. Readers will learn how this mash up of the real and virtual can translate into new learning possibilities, tools and environments. In the end, the book presents interesting predictions on how augmented learning will develop in the future.

You can find out more about the book here: http://www.palgrave.com/us/book/9781137342812#aboutBook.

index

The Reason for Seasons

Students often have the misconception that the distance from the sun is the main factor for the change in season. If that were the case, then the Northern and Southern Hemispheres would have the same seasons at the same time of the year, when in fact they are opposite.

Enlighten your students by modeling the movement of the Earth with some simple items. The setup pictured below includes a lamp to model the sun, a globe, a Wireless Light Sensor adhered to the globe with Velcro, and a meter stick to address those pesky misconceptions.

1

First we can look at the January in the Norther Hemisphere. Students should note the latitude and measure the light intensity using SPARKvue.

2

Then adhere the Wireless Light Sensor to the Southern Hemisphere at the same latitude as before, but well below the equator to measure the light intensity there.

3

The “brighter” students in the class will notice that tilt of the Earth has greatly affected the angle of the sensor relative to the lamp. Does the angle of incidence also affect the intensity of the light? The debate may be intense, but let students create a hypothesis before they collect data, then check the data to find out!

4

With the Earth is at this angle, there is a lot more light coming into the Southern Hemisphere. The amount of light that hits the an area on surface of the Earth is called insolation. The tilt of the Earth affects the solar insolation which is the reason we need insulation for the winter in the norther hemisphere while the Southern Hemisphere experiences summer. For students who assumed the seasons were based on the distance from the sun, this is truly a light bulb moment!

What is happening when the Earth is half-way around its orbit? No need to wait six months, we can fast forward to July simply by moving the globe to the other side of the lamp. Use the meter stick to make sure the globe is equidistant from the “sun” and affix the Wireless Light Sensor to the Northern Hemisphere.

5

The tit of the Earth hasn’t changed, but now the Northern Hemisphere is pointing more directly toward the lamp. Next we can move the sensor to the southern hemisphere to see if it is still as dazzling as before.

6

We can illuminate the effect by once again checking the data.

7

The light intensities have flipped from the previous run as the angle of incidence has changed. Now the Northern Hemisphere basks in the sun, while the Southern Hemisphere needs some insulation due to a lack of insolation.

Using SPARKvue software we can get a year in review by comparing the data.

8

Throughout this brilliant activity, student should see that the amount of light hitting the Earth’s surface at different parts of the year is based on the tilt of the Earth about its axis, not the distance from the sun. Hopefully, this activity has shed some light on the true reason for the seasons.

How much “Physics” can you do with a Smart Cart?

The list of great Physics applications for PASCO’s new Smart Cart keeps on growing!

smartcart

This fantastic new video previews 15 activities in just over 3 minutes. So fasten your seatbelt and prepare to be entertained as PASCO’s two seasoned physics specialists, Brett Sackett and J.J. Plank, go into high gear to present a very colourful demonstration of some of the best ways to use a Smart Cart in the classroom.

Wireless Temperature Contest Winner

Stephen Jacobs of St. Francis Xavier Secondary School is the winner of our contest for a classroom set (qty 10) of PASCO’s award winning wireless temperature sensors.

Please join us in congratulating Stephen!

Stephen’s submission was to use the PASCO Wireless Temperature Sensors to demonstrate the of Enthalpy of Hydration. We are looking forward to posting the results of his experiment in a future blog.

“After introducing the concept of enthalpy of hydration to my students, I give my students a small sample of cement (~ 10g), they add distilled water from a dropper (counting drops) or a buret (monitoring volume) and determine the ratio of water to cement sufficient create a mix that when placed onto a trowel, will remain as the trowel is rotated 90 degrees.

From this students learn the ideal ratio of water to cement.

Next, students are given a small quantity of cement (sufficient to fill a 400 mL beaker), and by ratio, the ideal amount of water is added slowly and the reactants are mixed with wooden paint sticks.  The thermometer is either coated with “Vaseline”/stopcock grease or “Saranwrap” and is placed into the center of the mixture in the beaker.  The temperature is monitored over time.  The cement cures with 24 hrs at which point the thermometer is removed.

Extensions…

  1. My students have coated the inside of used paper towel rolls with “Vaseline” and have made large quantities of cement to stuff inside these prepared rolls.  My students team up with Physics students to design different concrete compositions (fine sand, coarse sand, gravel (sorted by mesh size), and “rebar” (consisting of iron wire (available at TSC stores).  After chem students have measured the enthalpies of hydration, the physics students design experiments looking at the physics of cantilever beams…and test the beams to the point of failure.
  1. Instead of cement, I would combine calcium hydroxide and sand and have students measure the same reaction inside an improvised calorimeter.
  1. The topic extends far beyond the normal curriculum as my students learn about restoration work of historic structures and the fact that cement was invented just before the time of the Romans.”

Concentrate on the Conductivity

Students have a hard time concentrating when the topic is solution concentration. The solution may be having them create their own solutions.

Using some solid solutes and glassware, have them make a solution with a specific molarity. They should write down their own steps and follow their procedure. Make sure they are specific with the type of glassware and the quantities of solute and solvent. This is a good way for them to review items or steps that they may have forgotten and to put theory into practice.

Have them make two solutions of the same molarity: one from an ionic solute and the other from a covalent solute. After revising their procedure and correctly massing their solutes, you can take stock of their work, while they create stock solutions. Add a splash of food coloring to each solution to help them distinguish between the two. There is a good pedagogical reason, and an added bonus that a dash of color makes any activity more festive!

After making up their stock solutions from the solid solutes, they can concentrate on the concentration even more by making dilute solutions. They should create a series of dilutions that are the same volume. Before they start pouring, make sure they understand mole and volume relationships by have them write out their calculations and procedures.

Those drops of food dye will really come in handy as they prepare the solutions because they’ll serve as a visual check on the concentration! They can see that the solution is getting more dilute, and you can quickly see if they are on the right track.

Now it’s time to kick this solution investigation up a notch. They can measure the conductivity of the solutions using SPARKvue and the Wireless Conductivity Sensor.

3

First have them test the solutions with the ionic compound solute. As they collect the data, they should plot Conductivity vs. Concentration.

4

There are a couple of key concepts that they can quickly discern from this graph. The solutions containing the ionic compound are definitely electrolytic (they conduct electricity), and the conductivity is directly related to the concentration.

What happens with the covalent compound solutions? Will they see the same relationship?

5

There is a straight line on the graph for the covalent compound— it just happens to be flat and approximately zero for all the concentrations!  Even though they could see from the dyes that the solutions were different, the conductivity did not change. But why? These solutions are non-electrolytic. No matter how high or low the concentration, the conductivity will not be affected.

Through this activity, students get to concentrate on concentration by making and testing their own solutions. The food coloring and the Wireless Conductivity Sensor provide visual cues and quantitative data as the students construct their own cognitive concentration concepts (say that five times fast). Even a measurement of zero can be important because, in this case, it can drive home the important difference between electrolytes and non-electrolytes.

Save & Share Cart
Your Shopping Cart will be saved and you'll be given a link. You, or anyone with the link, can use it to retrieve your Cart at any time.
Back Save & Share Cart
Your Shopping Cart will be saved with Product pictures and information, and Cart Totals. Then send it to yourself, or a friend, with a link to retrieve it at any time.
Your cart email sent successfully :)