English Français

1-877-967-2726

Month: July 2018

The Cost of a STEM Education

Another major factor is simply the cost of a science and technology education – you can’t learn computer science without a working computer!

Technology has shaped education and how students learn – many teachers are opting to use online assignment submission, encouraging students to download lessons from a school website, and communicating to their students via Twitter. I still remember going to the computer lab with my class to play Math Circus, a series of circus mini-games geared to teach children math.

There are also so many free resources available for educators that can supplement their lessons and help students. Many of these resources are available through an app on a mobile platforms but what about schools and communities that don’t have the funds to access such technology?

Some schools have a Bring Your Own Device program to save the cost of buying a class set of tablets or laptops. Some schools discourage this program because it is not guaranteed that all students will have a device so they will purchase their own technology.

Technology Supports Inquiry Learning:

Whilst technology may have been a ‘want’ ten years ago, now it is a ‘need’ for educators as more provinces and school boards make 21st Century learning skills and inquiry skills a requirement for classrooms.

Inquiry-based learning is a pedagogy that is focused on learning using constructivism, which involves an individual’s participation to facilitate their own learning. In other words, a student must be engaged, actively thinking, asking questions, making connections between their knowledge and real-life examples, and use hands-on activities to concretize their theoretical knowledge (Minner, Levy, and Century, 2010, p. 476-476). In fact, inquiry-based learning has been shown to improve grades in physical science courses for non-STEM students (Hemraj-Benny and Beckford, 2014).

Inquiry learning is a fundamental aspect of science education since the nature of the subject is to ask questions and use what you know to develop a way to answer your question.

Even if a school can afford computer carts or tablets, there are recurring costs in a science department.  In a science department equipment such as glassware, reagents, and rats for dissection must be replenished every year in order to do experiments.

Experiments support a student’s inquiry skills which are important for a budding scientist but with the high cost associated with science experiments, how can students learn?

As previously mentioned in another blog, I struggled to understand physics so I only fully grasped it when I did the experiments. I was lucky to have a teacher that did an experiment at the end of every unit and to be in a well-equipped physics classroom with an air track, metal carts, optics equipment, and PASCO sensors. I cannot imagine passing my high school physics classes if I didn’t have the resources available.

What Can We Do?

There are many government funded outreach programs that bring science experiments to your classroom for free. Quite often, university students volunteer to visit the classroom for a workshop and they will bring all the necessary equipment to perform an experiment.

In my school we frequently had visitors for McMaster science and engineering outreach programs to do a specific experiment for that day. During one of these visits, each group of students were able to build their own circuit and create a solar car that we later tested outside.

There are many programs like this all around Canada and a lot of them are affiliated with a post-secondary institution so it can double as a career-planning workshop for your students. One of the biggest outreach programs and an incredible resource for science educators in Canada is Let’s Talk Science. Let’s Talk Science conveniently provides a page dedicated to finding a local outreach:

In terms of technology, there are a lot of grants available from some of the biggest companies in Canada such as the Best Buy School Tech Grant which also has a specific STEM school category and the Staples Superpower Your School Contest for environmentally conscious schools. Check out our AYVA grant page to see what’s available!


References:

Hemraj-Benny, T., & Beckford, I. (2014). Cooperative and Inquiry-Based Learning Utilizing Art-Related Topics: Teaching Chemistry to Community College Nonscience Majors. Journal of Chemical Education, 91, p. 1618-1622

Minner, D.D., Levy, A.J., & Century, J. (2010). Inquiry-based science instruction—what is it and does it matter? Results from a research synthesis years 1984 to 2002. Jouurnal of Research in Science Teaching, 47(4), p.474-496.

What Prevents Students from Pursuing STEM (And Why I Pursued It Anyway)

Article after article highlights the lack of diversity in STEM – not enough women, not enough racial minorities, not enough people from lower socioeconomic classes. There are also articles that dispute that the STEM gender gap doesn’t exist and that there are equally as many female STEM graduates as their male counterparts (that will be covered in a future blog).

Numbers aside, today I will be covering a few reasons why students don’t feel that a STEM career is an option for them and how I pursued one despite these reasons.

Some of the commonly cited reasons for students avoiding STEM are the lack of role models in these fields, peer pressure, and overall perception of STEM.

So why do people avoid STEM?

Students typically dismiss science educations because they do not see many role models that they identify with in this field. They feel that they would not fit in or underestimate their skills to pursue such a degree.

In a study by Microsoft, it was determined that having effective role models and support from parents and mentors are needed for females to see themselves in a STEM role. Exposure to STEM activities and real-world applications also influenced how females perceive STEM jobs and their class choices later in their life.

Although this study focused on women in STEM, these environmental factors can also influence students of different ethnicities, orientations, and abilities. Everybody has a different identity – it is important to realize that not one person fits into one single group. But the approach to encourage more students to pursue a science education is the same: good role models, a support system from educators and family, and exposure to science in different contexts.

Why I Still Ended Up in STEM

Although I had decided that I wanted to study science in high school, I nearly didn’t go into chemistry. My high school had a large proportion of students taking at least one senior science and many graduates pursued post-secondary educations in STEM. Science was something that all of my peers were doing and it was something that I excelled in so I decided to take all three courses offered (biology, physics, chemistry).

I loved my chemistry class – I did extremely well and it was so interesting to me. However, I was considering biology as a major because I didn’t excel in grade 11 physics and a chemistry major relied heavily on some physics concepts. Half of my friends were going into biology or healthcare but I couldn’t find a biology major that I was really interested in and I definitely did not want to go into nursing. At the time I was worried about risking my university acceptance average by taking such a difficult subject like grade 12 physics.

I reluctantly took grade 12 physics after consulting with my physics teacher even though I could get into my desired chemistry programs without it. Only a few of my friends were taking physics and I felt like everybody in my class smarter than me. The majority of my classmates were going into either engineering, computer science or pure physics.

I had many people in my life that encouraged me to pursue a chemistry degree but it was my physics teacher that helped solidify my choice.

My high school physics teacher was female and she was one of the best teachers in the school. To see a woman teach one of the hardest courses in the curriculum was quite encouraging for me especially since I doubted my abilities amongst my predominantly male pre-engineering peers.

She always tried to do what was best for her students which included telling us some hard truths. Her class also humbled me – I learned how to fail in her class and come out better. Even though I didn’t do as well in her class compared to my other courses, I finished that course feeling like I earned the mark.

Because of her support, I was able to picture myself studying chemistry and to not fear physics. She was always open to providing extra help and giving honest advice on university program choices.

I also had amazing support from my female peers in that class – the class went from 25 students at the beginning of the semester to about 7 by the end of the semester. Half of the students left in our little group were female including me and the entire class became more of a study group than an actual class. The small class size and the fact that I was not the only girl in the room helped me persevere through grade 12 physics. All of the females in that class ended up pursuing degrees in the physical sciences or engineering.

That is just one example of how being taught by somebody and being surrounded by peers that I identify with empowered me to study chemistry. This is why support, role models, and outreach programs are vital for encouraging more underrepresented groups to choose STEM careers.

Despite this, there are still other major reasons other than underrepresentation as to why Canada doesn’t have enough STEM graduates which will all be covered in next week’s blog!

A Student’s Perspective on STEM Education: A Blog Series

Throughout the summer, AYVA will be launching a blog series all about the use of technology in STEM education.

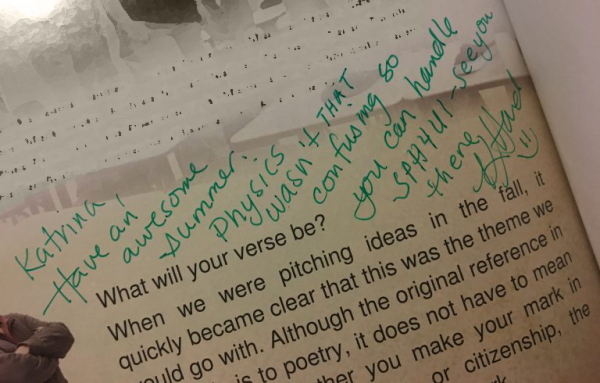
My name is Katrina and I started at AYVA in January as a co-op student from the University of Guelph. I am a Biological and Pharmaceutical Chemistry major and STEM education has always been something that I am passionate about. I feel like I am in a unique position to help improve it through AYVA as a student who has recently experienced secondary science education and is currently studying science in university. I have some perspective on how technology can be used to improve learning having used PASCO technology both in high school and university.

Through this series, I will be covering some successes, issues, and perspectives on the status of STEM education in Canada along with my personal experiences as a STEM student in Canada.

Why does this series matter?

I am one example of how good teaching can truly inspire a student to pursue science and can make a significant impact on their educational choices and career path.

I was very fortunate to go to a high school in the Dufferin-Peel Catholic School Board that had an incredible science department. In that department, I have had various role models and mentors who helped me realize what I wanted to do.

Through these teachers, I have had so many opportunities to confidently pursue science. They helped me attend STEM outreach camps, provided extra help and resources, let me into their classroom after class hours to talk about advanced topics and issues in science.

My high school mentor helped my friend and me to pursue a graduate-level research project at the University of Guelph while we were still in grade 12 for a competition. How many people could say that they did that at 17? I owe a lot to my teachers for helping me achieve my goals and for guiding me to where I am today.

I also attended a high school that was relatively new and as such had many resources available for inquiry learning. We had SmartBoards, laptop carts, and PASCO equipment for our science department. This technology helped supplement my lessons and made me understand some more difficult concepts. The PASCO equipment in particular helped me quite a bit in my physics classes – it was the only class where I never fully grasped concepts until I did the experiments.

With that being said, I know that not everybody has access to a good science education. I know that I am fortunate to have gone to a school with teachers that have the resources to ensure that their students succeed. This is why I am writing this series – I want to highlight some of the key issues in STEM education and give insight using my own experiences. Through this, I hope that I can inspire others to push for better and accessible STEM education.

And The Award Goes to Rory Armstrong

Pictured above: AYVA’s C.O.O. Brad Beveridge with Rory Armstrong at Huron Parks graduation ceremony.

Each year AYVA invites submissions from middle school students who have assumed leadership roles both at school and in the community.

We continue to be impressed by the caliber and commitment of those students who strive to make a difference.

This year’s winner was from Huron Park School in Midland, Ontario.

Congratulations Rory Armstrong, you are a role model indeed!

Titrations are pHun

Properties of acids, bases and the pH scale are core concepts in any chemistry class. After your students understand the basics, they need to be able to quantify reactions involving acids and bases with a titration.

A classic experiment is to determine the concentration of HCl(aq) by reacting it with 0.1 M NaOH(aq). To quantify this titration, and to make it more pHun, I used an indicator and a Wireless pH Sensor.

The volume of labware usually used for a titration can cause students to react with hesitation about the lab, so to keep the focus on the concepts, I minimize the amount of equipment. For a mini-titration station, I lighten the cognitive load by having students measure volumes in drops— no funnels, burets or volumetric glassware needed.

Titration1

In the setup above, I added 60 drops (~2 mL) of an unknown concentration of acid to a beaker on a magnetic stirrer. Then I used the Electrode Support to suspend a Wireless pH Sensor in the beaker with enough water to make sure the pH electrode is covered. Finally, I added a few drops of bromthymol blue indicator. I fired up SPARKvue and set up a table to manually collect pH measurements and the volume of NaOH.

Now, it was time to drop the bass base. I slowly added 0.1 M NaOH until the pH changed by 0.5 units (up to 13.0 units), recording the total drops of NaOH along the way.

Titration2

After only a few minutes, your student will have a constructed a pH titration curve with real measurements with no treble trouble. This data looks good to the last drop!

Students will be surprised at a couple of things. The number of drops needed to change the pH by 0.5 units is not always the same, and the shape of the titration curve is not a straight line, as many would have predicted.

Titration3

They will also have noticed that the indicator in the solution changed color, from yellow to blue, and there was a big jump in the pH with only 1 drop of NaOH.

So, what’s the point of all this data? In this case, there is an exact point they are looking for— the equivalence point.

Titration4

When the 60 drops of HCl were neutralized by 52 drops of 0.1 M NaOH — indicated by the color change and large jump in pH from below 7 to above 7— there were an equal number of moles of acid and base in the solution.

By incorporating the Wireless pH Sensor the students will not only perform a color-changing titration, but they will also have an opportunity to engage in some science and engineering practices with their data. And of course, have some pHun doing it!

Water Purification

Water is a precious resource, but not all water is potable and ready for consumption. Since water is a “the universal solvent,” it can dissolve many substances. Luckily, the physical and chemical properties of water and the solutes allow for purification if the water has been polluted. One method of water purification that students can model and re-engineer in the lab uses distillation and condensation.

For this activity you can collect a sample of water from any local source – a stream, creek or pond. Don’t go chasing waterfalls because you could also prepare you own sample. This blue “dirty” water sample was made right here at PASCO with some tap water, salt, starch and food coloring to make the changes more visual.

The first step is to make observations and measurements of the original sample. The blue color was obvious, but we also need to use sensors to measure the any unseen solutes.

First up, we can use the Wireless Conductivity Sensor to keep an eye on the ions by measuring any dissolved ionic solutes.

The conductivity reading is 17562 mS/cm. It isn’t apparent by looking at it, but the sensor makes it clear – there is a significant concentration of salts in the sample.

There’s no smoke in the water, but you can tell by looking closely that it is a little cloudy. The measure of cloudiness is called turbidity. We can use the Wireless Colorimeter and Turbidity Sensor to quantify the cloudiness.

The turbidity measures 111.7 NTUs. The data is clear, the water is cloudy. Based on the original observations and data, the water is blue, it has some dissolved ionic solutes, it also has some larger dissolved particles creating a suspension.  Â

Now for the fun part. It is time to purify the sample!

Some of the sample is poured into a small beaker and put on a hot plate and turned to the highest setting. In the image below, what you see isn’t a bridge over troubled water – it’s the new PASCO Condenser. The Condenser, with ice, is positioned over the beaker. As the “dirty” water boils, steam evaporates. The steam then hits the underside of the cold Condenser top and condenses from the gaseous state back into a liquid. Once in liquid form it collects in the black bottom of the Condenser.

Let it boil for 15 minutes and you should collect about 10 mL of “clean” water. Then pour into a test tube to compare to the original.

It definitely looks purer because we can now see it’s a clear, colorless liquid. But we need to collect more evidence to see if the purification was successful.

The data indicates that the water is clean as it looks! Both the conductivity and the turbidity measurements are now close to zero.

With this activity your students can gain some practical experience with a purification technique. The sensors provide them with clear evidence of the effectiveness of the process. The next step is to challenge your students to design and build their purification system!

Related Products:

Going Wireless: Shifting Augustana’s First-years Labs

Written by: David King, University of Alberta – Augustana Campus

The Augustana Campus chemistry labs have traditionally been perfectly acceptable, but have yielded somewhat standard chemistry experiments with very typical analysis. As a satellite campus of the University of Alberta, located in Camrose, Alberta, we have strived to be almost an extension of our North Campus sibling, which has proved problematic within the constraints of a 100 kilometers distance. Recently, things have changed. Last summer, we diverged from this straightforward and customary path and decided to do something slightly different. Along with our newly renovated labs—that encourage thought and collaboration—we have fundamentally changed our first-year chemistry lab experiments, which mean that different analyzation techniques are needed. Gone are vitamin C titrations with Tang and tablets, replaced by extraction techniques and spectral analysis. Hand-held spectroscopes have been replaced with a fiber optic cable in a light emissions lab while also adding a light measurement for chemiluminescence.

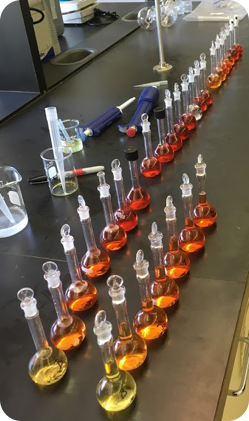
Our previous vitamin C laboratory experiment was based in a traditional vein, where titrations were used to determine the vitamin C content in both Tang (a powdered orange drink very few students today have ever experienced) and 500mg vitamin C tablets. Being a “traditional” lab exercise meant that most students likely had seen this done in high school or had done this very titration themselves. Our goal was to create an experience where the students learn a new analytical technique by extracting vitamin C from a pepper, then determining the vitamin C concentration from a standard calibration curve on a PASCO Wireless Spectrometer. All of these skills are taught in the first week of this exercise. Week two is all about the inquisitive nature and enthusiasm of the first-year chemistry students. We wanted them to start critically thinking about what they read and whether or not it is scientifically sound, and we also wanted students to gain confidence in their research abilities right away, both in a laboratory setting and with data analysis. The idea is that students would formulate a research question and then create a hypothesis to test in the lab to add to their skills. Since the PASCO Wireless Spectrometers allow us to keep data sets, we could use the same calibration curves throughout the testing.

Student Myths Tested:

  • Different cooking methods affect on Vitamin C
  • Different storage methods affect on Vitamin C
  • Freshly squeezed vs. prepackaged juice
  • Over the counter vitamin C supplements vs. natural sources
  • Comparing vitamin C content of fruits and vegetables from different international origins

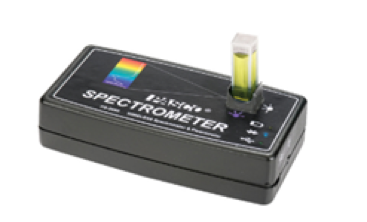
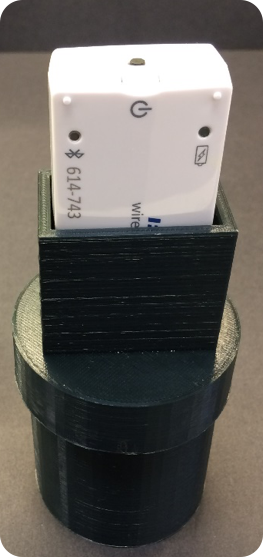
Light emissions lab experiments can be tedious at best. You need to constantly be looking through a hand-held spectroscope, which is exactly what we were asking our students to do. Also, we were looking at lights, flame tests and emission tubes with said spectroscopes. Throughout all of this, we weren’t asking the students to really do anything else, chemically speaking. Chemiluminescence and chromatography columns were two things we decided to add into our updated labs, along with the fiber optic cable accessory for the Wireless Spectrometers (as well as scaling back the spectroscope use). In the first part of our experiment, students would activate a glow stick and add the content to our 3D printed Light Calorimeter, then read the light emitted using the PASCO Wireless Light Sensor. From here, students would take the glow stick content and run it through a silica gel column to remove the chemical that activates the “glow”, then read the light emitted again. Peroxide and sodium salicylate would then be added to get the “glow” to return, and one last reading on SPARKvue would be taken.

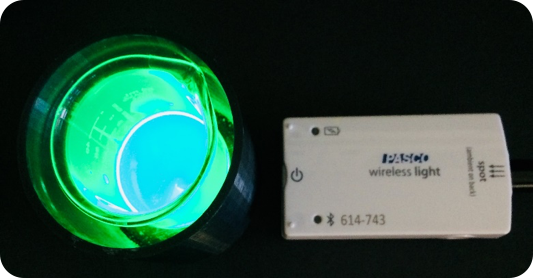
By using this method, we wanted students to learn not only about columns and their ability to separate mixtures but also to get comfortable learning how to collect data using a sensor and a data logger (in this case an iPad). In the second part of our experiment, we still use traditional light emission tubes (Argon, Helium, etc.) where we use spectroscopes to obtain the emission spectrum lines. For the hydrogen tube, however, we set up the fiber optic cable accessory and the PASCO Wireless Spectrometer to get the most precise emission light spectrum we can. Ideally, the students learn both techniques but come away with the appreciation for the newer tech.

Changing these two experiments to incorporate PASCO equipment and using different techniques has allowed the students to get a more modern feel for newer types of equipment and techniques that are more advanced than your “standard chemistry type” experiments.

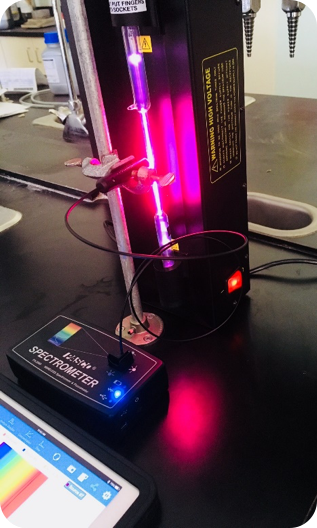
Since the wireless sensors are easily incorporated into our lab designs, we have set our sights on adding the brand new PASCO Wireless Colorimeter to our forensic based Escape Box Lab to give students an idea how an analysis of this type could be performed in the field.

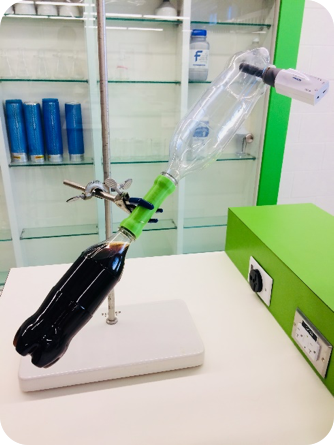
We also have a unique laboratory based three-week course for non-science majors that utilizes the PASCO Wireless CO2 sensor in an interesting way. Our laboratory future is both bright and innovative, and more importantly, possible, with the tools from PASCO at our disposal.


PASCO products mentioned in this article:

Save & Share Cart
Your Shopping Cart will be saved and you'll be given a link. You, or anyone with the link, can use it to retrieve your Cart at any time.
Back Save & Share Cart
Your Shopping Cart will be saved with Product pictures and information, and Cart Totals. Then send it to yourself, or a friend, with a link to retrieve it at any time.
Your cart email sent successfully :)