High-Impact, Low-Cost Demos: 5 Demos under $500

Conservation of angular momentum.
Your students will literally become part of the demonstration. Featuring cushioned handgrips, a pull cord with handle, and weighing only 6 pounds, the Gyroscope is very to use. Can be used with any rotatable office chair; however, for best performance it’s best to also get the PASCO Rotating Chair and Gyroscope Mass Set.
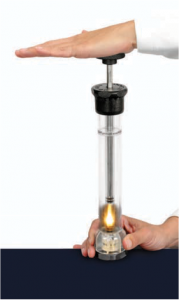
Catching Fire!
This demonstration is guaranteed to impress your students. By quickly pressing the piston down, the tightly sealed chamber will experience an increase in pressure and temperature well beyond the point to ignite a piece of paper.
Resonance Air Column with Speaker
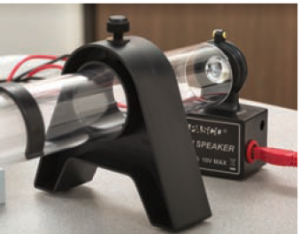
This demo will definitely ‘resonate’ with your students.
This low cost resonance tube works remarkably well. The molded piston head reflects sounds very efficiently and when positioned at a node will produce a very loud resonance
Use with the supplied speaker or a tuning fork
8 Adjustable rings to mark nodes
Can be used with or without a sound sensor
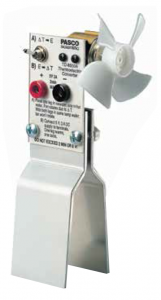
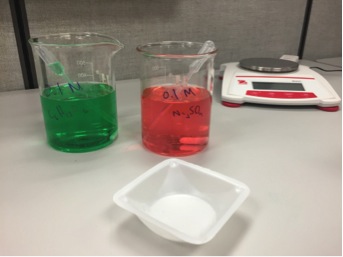
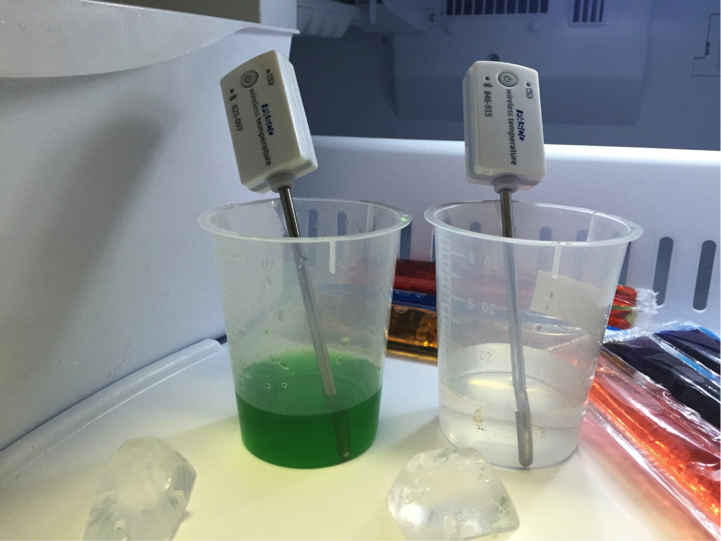
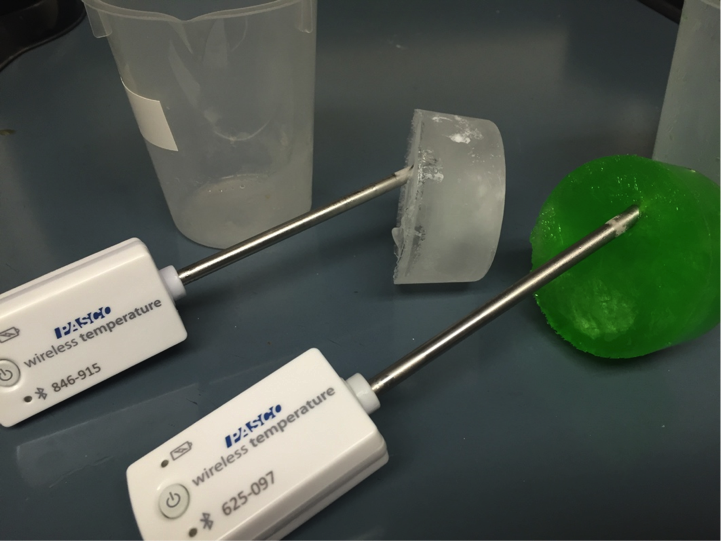
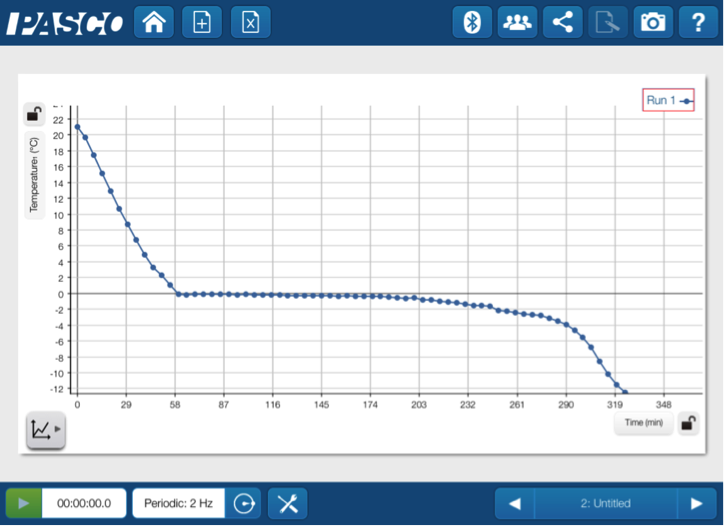
Demonstrate the first law of Thermodynamics.
Your students should know that you can heat water with electricity, but will be amazed to learn that you can use hot water to produce electrical energy. The Converter extracts electrical energy through a temperature differential by having one of its legs placed in a cup of cold water and the other leg in cup of hot water.
A series of semiconductor thermoelectric cells convert thermal energy into electrical energy
The process can be reversed by passing a current through the converter
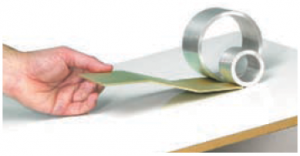
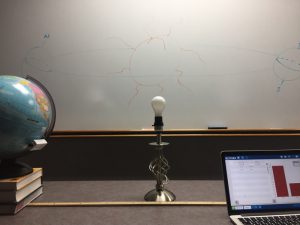
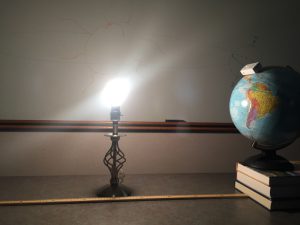
Rock and Roll! Compare rotational inertias with spheres and balls of different radius.
Your students will discover that the speed on an object rolling down a ramp is determined by the shape and distribution of its mass. They’ll be surprised to discover that the mass of the object and its radius does not affect the outcome.