English Français

1-877-967-2726

What’s YOUR weather like today …

Students are familiar with the concept of weather – they likely use an app to see what it’s going to be like every morning to decide what to wear. But do they know the difference between weather and climate? How can we help them understand that weather refers to local conditions over a short period of time while climate identifies atmospheric behavior over longer periods of time?

We can start by having them measure “what’s happening in your neck of the woods”. The question shouldn’t be “What is THE weather like today?” Instead it should be, “What is YOUR weather like today?”

This change in context can help them understand that weather is local. The conditions that they experience could be very different not only from what someone experiences across the country, but even from what the weather is like just a few miles away.

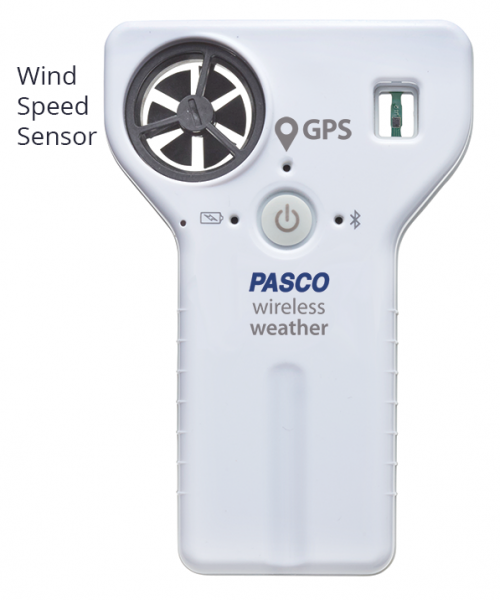
Using the Wireless Weather Sensor with GPS you can measure and monitor local weather conditions. Simply take it outside, connect to SPARKvue, and start collecting data.

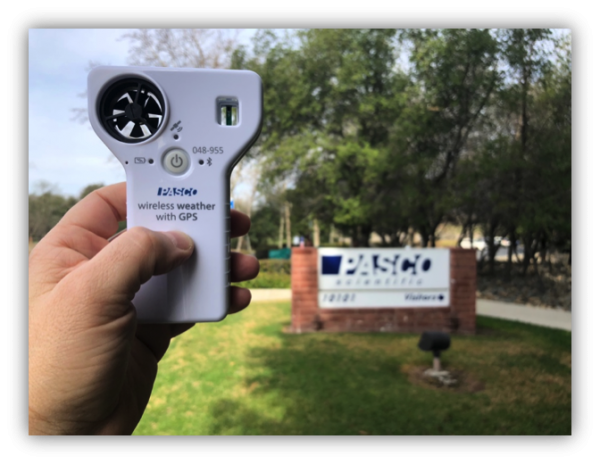
The sensor is capable of making 17 different measurements. To keep the data collection focused, you can set up a display to make the measurements look like a dashboard for your own personal (temporary) weather station

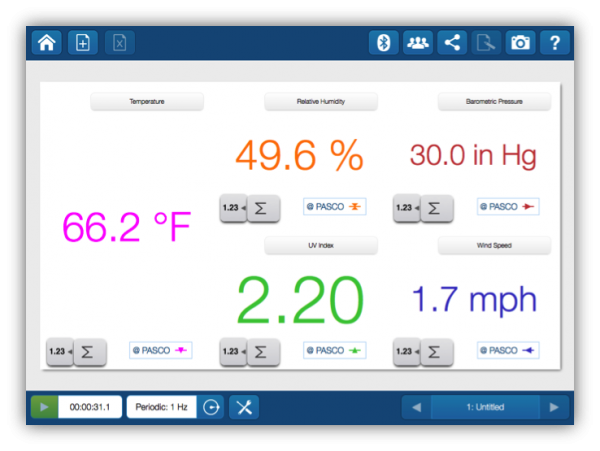
In SPARKvue you can change the units to match the units that are reported on actual weather stations. For example, in science we typically measure temperature in degrees Celsius, but weather in the US is reported in degrees Fahrenheit. This provides a good opportunity to talk about measurement units and how they are related.

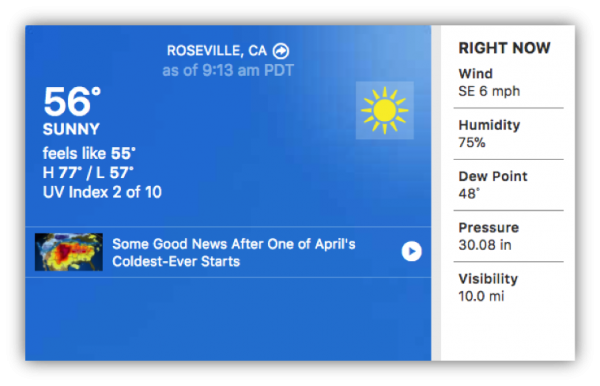
Once the students collect “their” weather data, they can check that against the forecasted weather for the area at the same time.

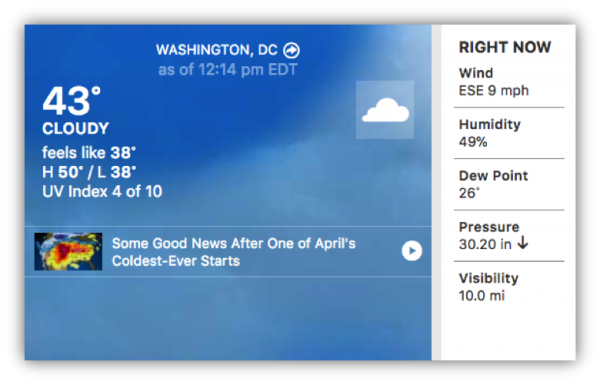
To get a broader perspective, students can compare “their” weather to conditions in other places at the same time. For instance, PASCO scientific is at a latitude of about 38.8 degrees north. Across the country, at about the same latitude, but a very different longitude, lies Washington, D.C.

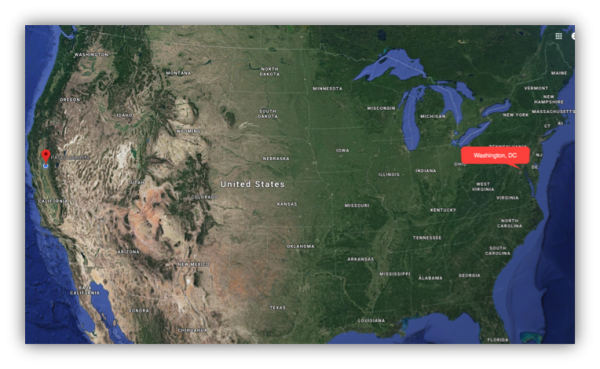
The change in longitude, going from the West Coast to the East Coast, can mean very different weather.

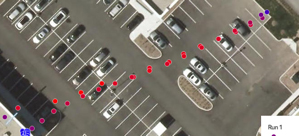
Your students don’t have to travel across the country to see differences in weather. Having multiple students collect data at different areas around the school or home provides a great opportunity to analyze data and incorporate science and engineering practices into your lesson. They can analyze and interpret the data by comparing both to each other’s data from different locations around the school, and to local and remote weather station data on the same day at the same time.

Using the Wireless Weather Sensor with GPS, students can not only collect data across a range of locations but also over periods of time. Weather can change from minute-to-minute, hour-to-hour, and season-to-season. As they look at averages over longer and longer periods of time, they are really beginning to look at how the climate is changing – not just short-term weather phenomena. To appreciate the difference between weather and climate, they would need to do some additional research and look at long-term historical weather data for their area.

Next time your students ask about THE weather, use the Wireless Weather sensor to collect some data so they can collect evidence about THEIR weather.

Related Products:

Wireless Weather Sensor with GPS (PS-3209)
SPARKvue Single User License (PS-2401)


AYVA Travels to PASCO for Global Partners Meeting

Six members of the AYVA Team spent last week in Roseville, California at PASCO Scientific’s headquarters.

We were excited to make new acquaintances and to reconnect with our friends from years gone by.

Representatives from more than 40 different countries had an opportunity to share success stories and receive training on PASCO’s latest products and new learning management software.

We even got a sneak peek at PASCO’s Roadmap for future development initiatives. A big shout out and thank you to our very gracious hosts at PASCO.

Kinematics for Senior Physics

Rick Debenedetti shares his experience with using a class set of Smart Carts to explore kinematics.  His presentation includes tips and demonstrations using SPARKvue software to introduce displacement, velocity and acceleration to a grade 11 physics class.

Learn how wireless technology allows students to explore authentic learning experiences within a limited time frame. Using wireless sensors means teachers can focus on the students rather than the equipment, and students are more likely to enjoy and learn from the activities, as they feel natural and are spontaneous.

This session demonstrates kinematics for senior physics.

The PASCO Smart Cart is the ultimate tool for studying kinematics, dynamics and more. It features built-in sensors that measure force, position, velocity, and 6 degrees of freedom in acceleration. Measurements can be made both on or off a dynamics track and transmit the data wirelessly over Bluetooth®.

Measuring Headwinds and GPS Speed with PASCO’s New Wirelsss Weather Sensor

PASCO’s new wireless weather & environmental sensor with GPS provides for some obvious investigations such as monitoring changes in weather.  However, as this sensor measures 17 different parameters, there are almost countless ways that measurements can be used individually or in combination to explore the world.

Two of the weather sensor’s 17 measurements relate to speed – the wind speed and movement speed of the sensor itself (as provided by the GPS sensor).  Recognizing the similarity of these two measurements I was curious if the weather sensor’s GPS could be used to assess the accuracy of the weather sensor’s wind speed measurement.

GPS speed has proven to be very accurate, especially in open spaces, where there are no trees or buildings blocking satellite signals.  Therefore, using the GPS to evaluate the accuracy of the wind speed sensor is a reasonable test.

Without over thinking the experimental test, I decided to go for a quick run across our parking lot holding the sensor up in the air like a torch carrier in the Olympics (okay maybe I’m over-romanticizing) and see how the headwind I generate from my sprint correlates to the GPS Speed measurement.

Being in less than optimum shape, after a long winter hiatus from anything resembling exercise, I kept my run to about 100 M (50 M in both directions).  Looking at the satellite image below that depicts my run (each dot is a separate measurement), you’ll see that there were cars in my way requiring several strenuous leaps.

Notwithstanding the strange looks I received during my run, the test proved quite successful.  The graph below shows wind speed in green and GPS Speed in blue.  During the first half of the run the two speeds correlate very closely.  On my return however there is a significant difference which I suspect was caused by a trailing wind gust that would have the effect of reducing the headwind.

In conclusion it appears that the Weather Sensor measures wind speed fairly accurately. However, in this test the wind speed sensor is measuring headwind which is a combination of traveling speed and actual wind.  Therefore more rigorous testing would be required to make a fair assessment, with external sources of wind eliminated or at least accounted for (can you think of ways how this might be done?).

In the classroom I suspect the weather sensor will be used in many interesting ways that has little to do with weather.  In the months to follow I hope to share some more of my playful discoveries with this sensor.

Clayton Ellis – Enzyme Catalysis Webinar – February 22, 2018

There is a great deal of biochemistry in the science curriculum that is a part of the foundational knowledge. One of the major molecules of study are proteins including how they are able to catalyze reactions.
The PASCO pressure sensor provides a very easy method and relatively quick way to determine how various factors might affect the rate of reaction. Students can then infer how the enzyme might be denatured due to the decrease in activity.
PASCO Products Used:
PASport Absolute Pressure Sensor
Alternately the Wireless Pressure Sensor can be used for this experiment.

Gauss Magnetism Accelerator: Grade 7 Science Project

Exploring Energy in Motion.
An amazing science fair project by Ryan V. of Oakville, Ontario.

If at first you don’t succeed, try-try again and this was exactly Ryan V’s attitude in completing his remarkable grade 7 science fair project on Magnetic Linear Accelerators.

The accelerator that Ryan built used a series of magnets and stationary marbles positioned in stages along a wooden track that resulted in a chain reaction with a final marble shooting off the end at an impressive speed.

Ryan was very interested in knowing the marble’s speed at various stages along the track and tried numerous techniques to take accurate measurements – however, all attempts were unsuccessful.

This is where AYVA and PASCO Scientific were able to help!  Using a PASCO Smart Gate and a Wireless Airlink Ryan was able to get the data he needed.

See the video for an excellent explanation and demonstration of how it all works.  No doubt Ryan will get an A++ for his hard work and persistence.

Products used:

Smart Gate

AirLink

Capstone

“Like Dissolves Like,” But How Much?

After introducing the concept of “like dissolves like,” sensors can be used to quantify how much solute is dissolved in a solution.

Conductivity is a great tool for quantifying the amount of particular types of solute in a solution. Depending on the type of solute, students can “conduct” an experiment that makes them concentrate on concentration.

There is a linear relationship between the concentration of an electrolyte and its conductivity.

In this activity, based on a lab in Essential Chemistry, the relationship between concentration and conductivity is explored and data is collected with the Wireless Conductivity sensor. The first set of data represents a solution with increasing amounts of salt added. Since salt is an electrolyte, the conductivity is linearly related to the concentration. The second set of data represents a sugar solution. Sugar is soluble in water but, as a non-electrolyte, the concentration cannot be related to the conductivity measurement.

Sugar may be sweet, but the conductivity data of sugar solutions is definitely not. Luckily, sugar molecules have a chiral center and are optically active. The amount of optical rotation will depend on the type and amount of sugar present. Using a Wireless Polarimeter, you can measure the optical rotation of a variety of sugar solution concentrations.

The Polarimeter measures the light intensity vs the angle of rotation.

The change in optical rotation is linearly related to the concentration of the sugar solution.

Determining the amount of solute in a solution is an important part of any chemistry class. Having the appropriate sensors, and knowing the properties of the solutes and solvents, gives students the tools they need to quantify the concentration of a solution.

Related Products:

Wireless Conductivity Sensor (PS-3210)
Polarimeter (PS-3237)

Poinsettia pH paper

The winter season is almost upon us. That means thoughts of holidays, hot chocolate, and Poinsettias. In chemistry class, you can use Poinsettias to introduce the concept of pH. Whether you are studying acids and bases, or simply looking at chemical changes, being able to observe changes in pH is an important tool for your budding chemistry students.

A Poinsettia is one of many plants containing pigments that respond to changes in acidity.

You can take the mystery out of litmus paper and pH indicators by having the student create their own Poinsettia pH paper. The red pigment from deeply colored poinsettias can be extracted and used to make paper strips to test whether a liquid is an acid or a base.


To make the Poinsettia pH paper:

  1. Cut the flower petals (actually specialized leaves called bracts) into strips.
  2. Place the strips into a beaker.
  3. Add enough water to cover the plant material and simmer on a hot plate.
  4. Filter the liquid into another container and discard the solid plant matter.
  5. Saturate a piece of filter paper with the poinsettia extract.
  6. Allow the filter paper to dry and cut the colored paper into test strips.

Now you can use the strips to test the acidity and basicity of solutions. To make the activity more meaningful, you could construct a pH chart for your plant extract paper. Using some stock solutions of 0.1 M HCl and 0.1 M NaOH, you can prepare solutions of different pH values. Your students can quantity the pH of the new solutions with a Wireless pH sensor. Now that they have solutions of a known pH, they can create a pH color chart with the poinsettia paper. (The color range for acids and bases with depend on the particular plant.)


Poinsettia pH paper    
pH
Color


With this brief activity, you have the opportunity to take a holiday tradition and turn it an engaging and educational experience.

Related Products:

Trick or titrate!

Your students may have outgrown getting dressed up to go trick-or-treating, but they haven’t yet outgrown the desire to collect and consume as much candy as possible. So what can you do to help them avoid a belly ache and put that candy to good use? Perform an experiment!

Coincidentally, National Chemistry Week is coming up just before Halloween, and the theme this year is “Chemistry Colors our World”. We’ve put together a fun activity that incorporates core chemistry concepts, Halloween candy, and colour to fit the festive season. Instead of tasting the rainbow, your students will get to titrate the rainbow as they determine the amount of citric acid in Skittles™.

Citric acid (H3C6H5O7) is one of the first ingredients in Skittles which means your students can perform a titration with a base (in this case NaOH) to find the amount of citric acid per Skittle using the following balanced equation:

3 NaOH (aq) + H3C6H5O7 (aq) → 3H2O (l) + Na3C6H5O(aq)

Now, it’s likely that your students will volunteer to do a taste test to determine the candy’s acidity level. Remember, the first rule of the lab is that we don’t eat things in the lab. But that doesn’t mean we can’t create a nice Skittles solution!

Our recipe calls for 10 yellow Skittles added to enough water to make a 50mL solution— stirred, not shaken (until the candy dissolves). This process should take about 10 minutes.

With most titrations, chemists know that it’s all ‘bout that base— and now it’s time to prep it. Provide your students with a stock solution of 0.2 M NaOH and have them prepare a 0.020 M NaOH solution for the experiment. It’s always good practice for them to prep their own solutions using the appropriate glassware!

Once the base is ready, they should rinse and fill a Drop Dispenser with the titrant. Then they need to prepare the Skittles sample in a beaker by adding a 10 mL aliquot of the Skittles solution, some water, a few drops of phenolphthalein, and a pH Probe.

A drop dispenser with titrant along with the Skittles solution

The Skittles sample is still yellow from the dyes in the candy. Choose lighter colored Skittles for this step so the color change of the phenolthphalein indicator at equivalence will be obvious. Thymolphthalein will also work for some of the darker colored Skittles, and the pH data is like the pot of gold at the end of the rainbow and will show your students what their eyes might miss!

Now its time to titrate the treat. Start data collection and open the valve on the Drop Dispenser so that 1-2 drops of 0.02 M NaOH are added every second.

The Skittle solution starting to change color as the pH changes

Notice the subtle streaks of pink in the solution as the reaction proceeds and the pH changes.

Pink Skittle solution after titration

Students should record the volume when the pink is permanent and continue to titrate a few more milliliters of NaOH. Now they’ve created a great new Skittles color! More importantly, the data looks beautiful too.

Looking at the graph, the students can observe that the sharp change in the pH occurred when the indicator took on the permanent pink color.

NOTE: Even though citric acid is triprotic, there is only one noticeable equivalence point on the graph after all three of the ionizable hydrogens have reacted. This is because of overlapping buffer regions of the acids and their conjugates.

After the titration of the treat, it’s time for the tricky part— data analysis. Using the volume of NaOH at equivalence, the concentration of NaOH, and the balanced equation, the students can calculate the amount of citric acid in the 10 mL sample that was reacted. From here they can calculate the amount of citric acid in their original 10 Skittles sample and finally in each Skittle.

Now that they have the basic technique down, students can design their own experiment by coming up with a question that they could answer with a titration. For example, they could compare between different colours of Skittles, between Skittles and other candies containing citric acid, and between Skittles and lemon juice.

I hope your students enjoy this titration activity and get spooktacular results. Happy Halloween!

Related Products:

Glow in the Dark Science!

Fall is in full swing and Halloween is approaching. It’s the time of year for glowing ghosts, ghouls, and… science experiments!

Things that appear to glow are luminescent. Luminescent materials are literally “cool” because they give off light without needing or producing heat. Luminescence can be broken down into the following main categories: fluorescence, phosphorescence, and chemiluminescence.

Fluorescent materials will absorb energy, then quickly re-emit the energy. As a result, they only appear to “fluoresce” when they are in the presence of some form of radiation such as ultraviolet light.

The PASCO Spectrometer allows you and your students to experiment with fluorescence. Fluorescein, as the name implies, is a chemical that will exhibit fluorescence. In this demonstration, a small sample of fluorescein is diluted in water, then added to a cuvette. When held under a blacklight (ultraviolet radiation source) the sample will glow. In the Spectrometry App under Fluorescence, we can set an excitation wavelength to 405 nm.

excitation 405 nm
Spectrum of the 405 nm light used for fluorescence excitation.

When the cuvette with fluorescein is added to the Spectrometer, you can observe the “glow” indicating fluorescence.

PASCO spectrometer and sample
Fluorescein “glowing” in the PASCO Spectrometer.

Now we can observe the spectrum of the emitted light when fluorescein is excited with 405 nm light.

Fluorescence
The spectrum of fluorescein

By overlaying the spectra, we can compare the wavelength of the light that went into the sample and the light that was fluoresced by the sample.

Comparison of spectra
Notice the shift to a higher wavelength from excitation to emission.

Phosphorescent materials glow in the dark. Similar to fluorescence, they get excited by white or ultraviolet lights. But these materials slowly re-emit the energy in the form of light, even when the lights are turned off. Glow-in-the-dark toys are a great example of phosphorescence.

Finally, chemiluminescence occurs when a chemical reaction produces light without producing heat. Glow sticks are a perfect Halloween example of this. When the chemicals are mixed, a ghostly glow is given off.

So, the next time you see a glowing jack-o-lantern or an eerie zombie, don’t just think scary… think science.

Related Product:

Save & Share Cart
Your Shopping Cart will be saved and you'll be given a link. You, or anyone with the link, can use it to retrieve your Cart at any time.
Back Save & Share Cart
Your Shopping Cart will be saved with Product pictures and information, and Cart Totals. Then send it to yourself, or a friend, with a link to retrieve it at any time.
Your cart email sent successfully :)