The use of technology in STEM education is quite important because it supports inquiry learning. With the newest innovations from science equipment companies such as PASCO, there are even more ways to support inquiry using hands-on learning. In several independent studies, using inquiry-based learning has improved student confidence, interest, and performance in physical sciences.
The Impact of Inquiry Learning for Science Students
One study in Thailand by Tanahoung, Chitaree, Soankwan, Manjula and Johnston (2009) compared two first year introductory physics classes at the same university. One class was taught using a traditional method while the other class used Interactive Lecture Demonstrations. Interactive Lecture Demonstrations is a form of inquiry; students first predict the outcome of an experiment individually and then in groups. The demonstration is performed in real-time using micro-computer based laboratory tools (in this case a PASCO interface and a temperature sensor) and then students and/or instructor reflect on the concept based on their predictions and the actual results. For each thermodynamics concept, a pre-lecture and a post-lecture test was administered for comparison.
Tanahoung et al. found that in almost all of the concepts, there was a greater increased of percentage of correct answers between tests from the experimental group than the control group. These results show that teaching methods that use inquiry and technology are a novel and viable pedagogy for the 21st century.
Inquiry-based learning has been shown to improve grades in physical science courses for non-STEM students. In one particular study by Hemraj-Benny and Beckford (2014), a chemistry concepts such as light and matter was taught in relation to visual arts using a combination of traditional lectures and inquiry activities. The experimental group participated in group discussions, performed experiments using worksheets, created presentations, and had a summary lecture from the instructor. In contrast, the control group only had lecture-style lessons in which the instructor went over PowerPoint slides and certain scientific experiments in detail.
As a result, the class that received both inquiry and traditional lessons performed better in their final exam than the control group. More students in the experimental group reported better confidence and less fear in science than the control. Interestingly, Heraj and Beckford found that both the control and experimental group reported to have a greater appreciation of the scientific world after completing this course. Overall, this experiment shows that inquiry methods are especially beneficial for non-STEM students in understanding physical sciences. The critical skills taught in this course is an excellent example of how STEM skills can benefit everyone, including non-STEM majors.
The use of personal multifunctional chemical analysis systems has greatly improved student perception on chemistry experiments. As reported by Vanatta, Richard-Babb, and Solomon (2010), West Virgina University switched to the PASCO SPARK learning system and reported several benefits to using such systems like “less ‘waiting around time’” (Vannatta, Richard-Babb & Solomon, 2010, p. 772), the possibility of interdisciplinary and field experiments due to the versatility of using such equipment. Such as portability, ease of use and using microcomputer-based laboratories allows students to move at their own pace instead of waiting for others to move on. All of these benefits are factors to increased student retention and interest in chemistry majors.
Additionally, PASCO has upgraded from the portable SPARK learning system with built-in software to the downloadable SPARKvue software for computers and mobile devices. In another study, Priest, Pyke, and Williamson (2014) compare student perception using a handheld datalogger (the PASCO GLX system) versus SPARKvue on a laptop for the same chemistry experiment. Students were surveyed after using the GLX system for a vapour pressure experiment on their opinion on the lab. The next year, the school had phased out the GLX system and introduced SPARKvue using a laptop interface but kept the lab exactly the same. Researchers noticed more positive responses to the experiment when students used the laptop interface. Students perceived that the experiment was simpler and that the content was easier to understand when using SPARKvue because students are more familiar with a laptop and not a traditional datalogger, they experienced less frustration and spent less time learning how to use the necessary software to gather data.
A Guided Inquiry Lab – Results May Vary!
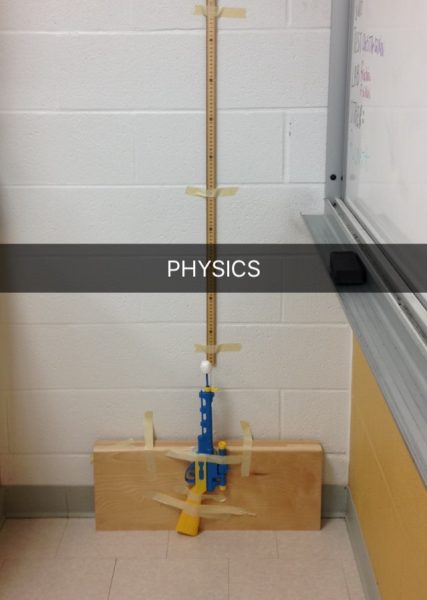
In my own studies, I benefited from inquiry labs and technology definitely made these labs easier. One of my favourite labs was a dart gun experiment where our groups were challenged to determine the theoretical spring constant of a dollar store dart gun by devising our own method. The goal of the experiment wasn’t to determine the actual spring constant since there weren’t actual springs in the dart gun, but to use what we knew from other units to create an experiment. We were given free reign over all the equipment in the classroom including the PASCO GLX and motion sensor and needed to keep a lab notebook in order to note any changes to the experimental method.
My partner and I opted for a low-tech option (pictured right) – we weighed the dart and determined the maximum height of its flight upwards so we could plug it into a kinematics equation to find the vertical velocity of the dart when it exited the chamber. This method was sort of tedious – I would launch the dart from the floor while my friend would video the dart on her phone while standing on a chair so we could replay and record when it reaches maximum height. This resulted in a few mishaps such as the dart perfectly falling into the adjacent broken glass box which we promptly moved. We also had to make several modifications to our experiment design to ensure that our data collection was consistent such as taping the dart gun so it exits perpendicular to the ground and adding weight to the dart gun so it doesn’t hit the ceiling before it reached its maximum height.
Another group decided on the easier (and safer) option of using the GLX and motion sensor to capture the horizontal acceleration of the dart when launched off of the table to model a Type 1 Projectile Motion problem. This method reduced a lot of uncertainty in their calculations since the sensors could accurately capture their data and they had the added benefit of not needing to precariously stand on a chair and guess-timate the maximum height. They also managed to finish a lot earlier and have more experimental runs than we did.
Although the sensors did end up making the experiment a lot easier for them, both of our groups were able to make connections between units and truly use the scientific method which made the experiment so much more interesting than our usual structured inquiry labs.
How You Can Support Inquiry Learning in Your Classroom
From these studies it is clear that inquiry-based learning and technology in STEM classrooms have short-term benefits such as increasing student interest and confidence. In addition, these two approaches to learning are complimentary to each other. The ease of use from technology decreases wait times and allows students to move at their own pace. Because students can move at their own pace, they are able to ask questions about the experiment itself. Students are able to benefit from making mistakes in this environment because the data logging software allows them to analyze what they did incorrect and why it is happening.
Through this approach, students are able to be curious in a controlled environment whilst developing essential scientific inquiry skills. There is also more time for meaningful discussion during class through using probeware since it reduces the amount of set up and lessons on how to use the equipment. Because of this, students are less likely to get frustrated or bored from experiments and helps students understand or reinforce their knowledge in the subject. This could improve the number of students pursuing a science education since students are less likely to leave if they are interested and confident in what they are learning.
PASCO and AYVA have a significant amount of resources that further demonstrates the positive impact that probeware technology has in science education such as White Papers on how PASCO supports scientific inquiry. AYVA also provides Curriculum Correlations for Canadian provinces which provides suggestions on how to incorporate PASCO technology into science classrooms across Canada.
References
Hemraj-Benny, T., & Beckford, I. (2014). Cooperative and Inquiry-Based Learning Utilizing Art-Related Topics: Teaching Chemistry to Community College Nonscience Majors. Journal of Chemical Education, 91, p. 1618-1622
Priest, S.J., Pyke, S.M., & Williamson, N.M. (2014). Student Perceptions of Chemistry Experiments with Different Technological Interfaces: A Comparative Study. Journal of Chemical Education, 91, p.1787-1795.
Tanahoung, C., Chitaree, R., Soankwan, C., Sharma, M.D., & Johnston, I.D., (2009). The effect of Interactive Lecture Demonstrations on students’ understanding of heat and temperature: a study from Thailand. Research in Science & Technological Education, 27(1), p. 61-74.
Vannatta, M.W., Richards-Babb, M., & Solomon, S.D. (2010). Personal Multifunctional Chemical Analysis Systems for Undergraduate Chemistry Laboratory Curricula. Joural of Chemical Education, 87(8), p. 770-772.


 Although Math is its own discipline in STEM, all the other disciplines (science, technology, and engineering) inevitably involves math in some way. So many students have a fear of math and will avoid certain disciplines because it requires math. Quite often I would hear my classmates say that they won’t apply to a specific post-secondary program because it requires grade 12 calculus. This fear of math is so prevalent in our culture that it is almost like a badge of honour to say that you’re “not a math person”. My first year calculus professor has a good blog posts (
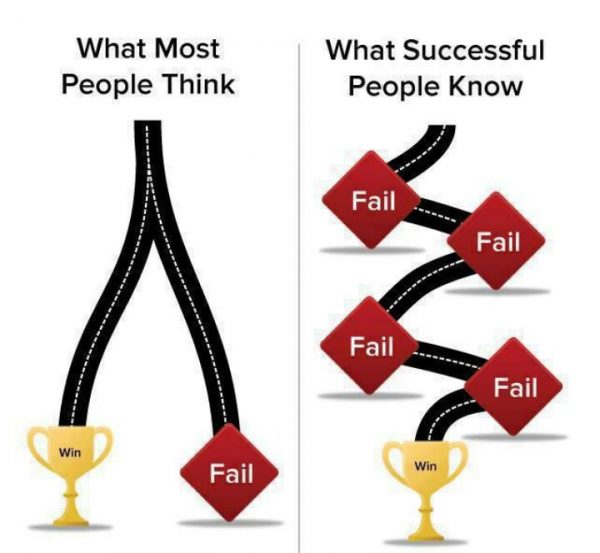


 My name is Katrina and I started at AYVA in January as a co-op student from the University of Guelph. I am a Biological and Pharmaceutical Chemistry major and STEM education has always been something that I am passionate about. I feel like I am in a unique position to help improve it through AYVA as a student who has recently experienced secondary science education and is currently studying science in university. I have some perspective on how technology can be used to improve learning having used PASCO technology both in high school and university.