English Français

1-877-967-2726

Month: March 2023

Growing Tomatoes With the Greenhouse Sense & Control Kit

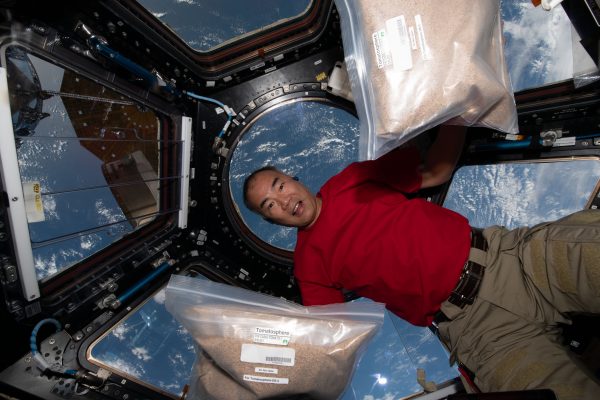
Over the last couple of months, AYVA Educational Solutions has been growing tomato plants from the Let’s Talk Science Tomatosphere project. In this project, you are given two unknown packets of seeds, labeled T and U. One packet of seeds have been to space, while the other has not. The purpose of this experiment is to germinate and grow the tomato plants from both packets, tracking their growth, and hypothesizing which plants are the space seeds! You can guess which ones you think are the space seeds in the survey at the bottom of this post! Submit your hypothesis and you will automatically be entered into a raffle to win a free PASCO Wireless Temperature Sensor! If you would like to find out which seeds have been to space we encourage you to participate in this fantastic program!! Sign up for your own packet of seeds here.

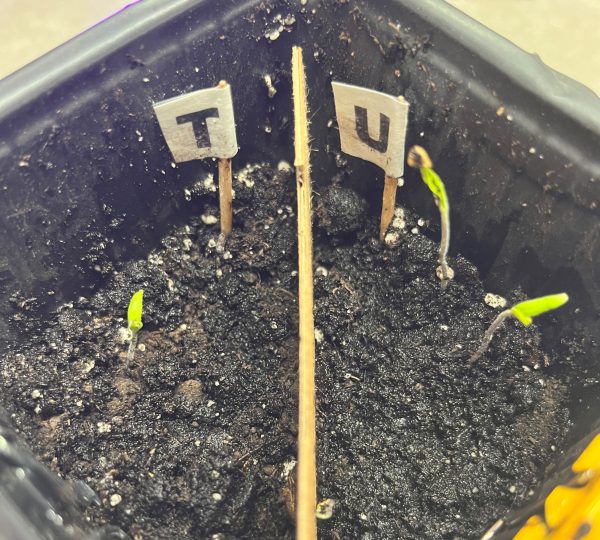
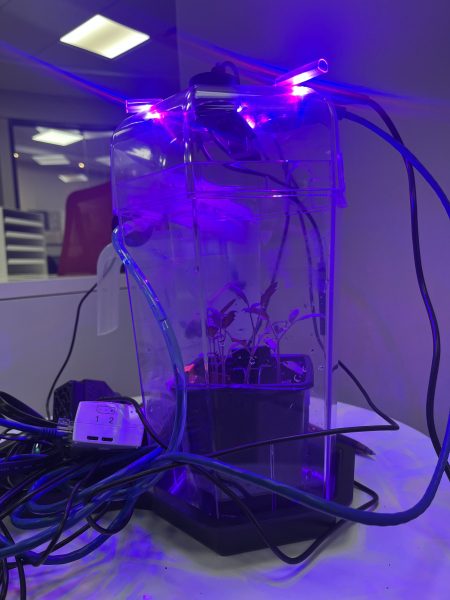
We used PASCO’s ST-2997 Greenhouse Sense and Control Kit to monitor and regulate conditions for optimal growth! By researching the optimal growing conditions for a tomato plant, we adjusted the levels of the greenhouse system to meet those needs.

Using Blockly, we block coded the Greenhouse conditions we desired, programming a 24 hour sunlight and watering cycle, and ensuring the temperature stayed at 23 degrees Celsius at all times. Once the code was exported into the //control.Node, we planted 3 seeds from each packet on the appropriate sides (T or U).

We tracked the growth of our plants from January 20th to March 31st, as they developed, they went from seeds to leafy plants.

After just one week of being inside the Greenhouse, three out of six seeds germinated and sprouted! As a couple more weeks went by, two more seeds sprouted. Unfortunately, one seed (on the T side) did not germinate. Overall totaling three plants on the U side, two on the T side. At this point, we hypothesized which of the seeds had been to space and which had not, and wrote down our predictions to compare to the results later on. You can share your predictions in the survey at the bottom of this post, and find out which seeds were the space seeds!

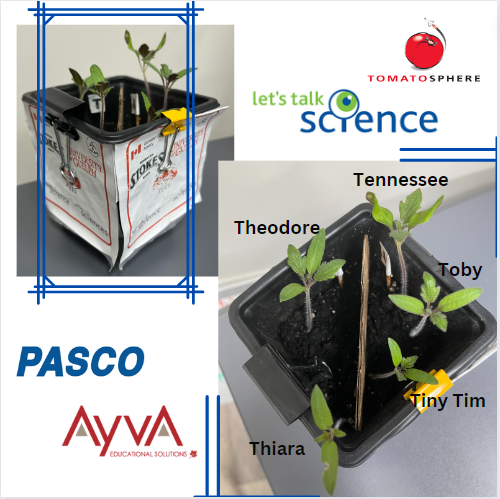
In the fourth week of growth we decided to name the plants so that they could be more easily identified, charted, and referred to. On the U side, we named the tomato plants Tennessee, Toby, and Tiny Tim. Then on the T side, we named the plants Thiara and Theodore. Tiny Tim was the smallest plant during the beginning of the growth period, while Tennessee was the largest of the seedlings. Thiara also germinated the latest of any of the seeds, excluding the one seed that never sprouted. She quickly caught up to the others though, and in the 4th week she was the 3rd tallest of them.

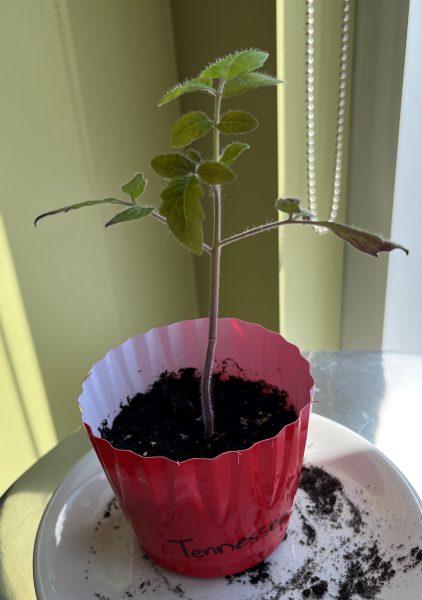
After 6 weeks of growth, the plants were beginning to falter as they combatted against one another for nutrients and water. To replenish what they lost, we decided to separate the plants. Three of the plants, Tennessee, Tiny Tim and Thiara were moved to their own pots. However, Toby and Theodore remained in the self-regulating greenhouse to continue identical conditions. Within days of separating the plants, they all began to look healthier as they received the nutrients and space that they needed.

Into the ninth week of the experiment, the plants are growing taller and broader. Now that they each have their own space, they are able to thrive. The featured photo on the right shows Tennessee healthy and strong! With no one contesting him for nutrients, he is tall, green and healthy. At this point, they are almost fully mature, and will be entering the flowering stage shortly. This week we decided to reveal the answer to the lingering question we had been wondering for months – which seeds had been to space? Was it Theodore and Thiara (T Side)? Or perhaps did Toby, Tiny Tim and Tennessee (U side) spend some time in space? Find out the answer below!

Shoutout to the PASCO Greenhouse, as this project could not have been as successful without it! The self-regulating greenhouse allowed us to grow the plants healthy and strong -with minimal intervention from us. We were able to germinate 5/6 seeds and maintain the ideal moisture and temperature levels for the plants to grow, even amidst a cold and dark winter with many days out of the office. PASCO’s Greenhouse is the perfect educational kit for your classroom, teaching students several ecological concepts such as photosynthesis, anatomy of plants, and the ways different conditions affect the growth of plants – all with the new focus and importance of coding. You can start the Tomatosphere project yourself, and facilitate it with the Greenhouse Sense and Control Kit as well.

Make sure to answer the survey below to find out which seeds have been to space and for a chance to win a PASCO Wireless Temperature Sensor! We would love to hear what you think, so share your guesses with us, and your reasoning if you have any!


Featured Products:

PASCO ST-2997 Greenhouse Sense and Control Kit

SPARKvue

Wireless Temperature Sensor


Tracking Acceleration During A Hockey Game

Acceleration and velocity are present everywhere in life, from sports to driving, to walking around. With PASCO’s Wireless Acceleration Altimeter, I decided to see what I can learn from the 7 different data points that it records.

As a hockey player for 18 years, I’ve always wondered how quickly I’m moving on the ice, having never seen myself skate or recorded my speed. I assume of course, that I am right up there with Connor McDavid in terms of speed. I expect the sensor to be able to confirm that for me, while also telling me even more information – my acceleration and velocity in the x, y, and z directions.

The first step in my experiment was to put the sensor into remote data logging mode, so that the altimeter is recording data into its internal storage, instead of needing to be connected to a phone or computer.

When setting up the altimeter, I changed the frequency to 5 Hz, (5 data points per second). The altimeter can record up to 200 Hz but has a limited capacity for how much data it can keep in its internal storage. Once I had put the sensor into remote data logging mode, I used the included Velcro straps to attach it to the back of my shin guard and got ready to step onto the ice.

For the first 9 minutes of the data recording, I am putting all of my equipment on, so the velocity and acceleration are relatively low as I stay within the dressing room.  At the 10-minute mark warm-up begins. For these 5 minutes, I’m constantly moving while I’m skating on the ice, so the acceleration is constantly changing and staying at numbers of higher magnitude.

The magnitude of the data is also slightly decreasing during the 5-minute stretch as I slow down and conserve more energy for the game. When comparing the peaks of this stretch to the peaks of acceleration later on, it’s clear that I wasn’t accelerating as much in warm-ups as I would be when I was playing the game.

At the 15-minute mark, the game begins and I’m on the bench for the first shift, but at 18.5 minutes I get on the ice. There are bursts of acceleration as I get up to speed and little sections of coasting until 19 minutes when there’s a stoppage in play and the acceleration goes down and remains relatively constant. When the play resumes my acceleration begins to spike and then fluctuates throughout the natural progression of the game, as I coast at times and race to get the puck at others.

Over the course of the rest of the game, the peaks and valleys of the graph show clearly when I was on the ice accelerating and decelerating, and when I was on the bench, with the little movement just being from sliding across the bench or standing up to cheer on a goal.

In the different peaks in the graph, it can be seen which shifts I accelerated the most, and which I had a bit less energy. On the first shift of the game, my peak acceleration is 32 m/s2, which is high, but not the highest acceleration of the game. On this shift though, there are 60 data points where my acceleration is greater than 15 m/s2.

Because we are recording at 5 Hz, we can take that to mean that there are 12 seconds in which my acceleration is greater than 15 m/s2. This is not all in one 12-second stretch though, it’s spread out throughout the shift in groupings or bursts of acceleration. By comparison, the shift with the next highest amount of data points over 15 m/s2 is my 4th shift, in which there are 50 such points, or approximately 10 seconds. This 2-second difference is evidence to point towards my fatigue, as the number of such data points decreased more as the game went on, with the final full-length shift containing only 34 of these points (6.8 seconds).

The highest acceleration recorded is 34 m/s2, and that is on the 5th shift of the game. It would seem abnormal that my highest acceleration would be on the 5th shift, as I am already more tired at this point. There is context to explain the abnormality though – on the 5th shift we broke out on a 2-on-1 and I had to accelerate as fast as I could to free myself up to receive the pass and score a goal.

Overall it was a very interesting and insightful experience looking into the data surrounding my skating and gameplay. While I don’t think my acceleration is quite up to par with Connor McDavid, I can say I’m satisfied with my results and happy that the data logging had ended by the time I ended up in the penalty box.

With the Acceleration Altimeter, there are so many cool and interesting ways to record and examine data, and I got a fascinating look at just one of the possibilities by taking it with me during my hockey game. Additionally, there are other data points that weren’t useful for my experience, with angular velocity, altitude, and acceleration in the z direction – playing hockey on a flat sheet of ice somewhat limits how much vertical movement can be performed. I’m excited to dig deeper into the data and for other possibilities and opportunities in the future to learn more, using PASCO’s wireless sensors.

Featured Products:

Wireless Accelerometer/Altimeter

SPARKvue

Wireless Sensors are Now Stocked in Oakville!

Here are just a few of the products currently available! If you need something quickly, please give us a call @ 877-967-2726. We can ship across Canada for delivery within a few days for all Canadian stocked items.

Also in-stock & on sale!!

Many of PASCO’s wireless sensors are now stocked in Oakville, Ontario.

Smart Carts
Red: ME-1240
Blue: ME-1241

Wireless pH Sensor
PS-3204

Wireless Light Sensor
PS-3213

Wireless Temperature Sensor
PS-3201

Wireless Sound Sensor
PS-3227

Wireless EKG Sensor
PS-3236

Wireless Spirometer
PS-3234

Wireless Force Sensor
PS-3202

Wireless Soil Moisture Sensor
PS-3228

Airlink
PS-3200

Wireless Acceleration Sensor
PS-3223

Wireless Colorimeter
PS-3215

Wireless Pressure Sensor
PS-3203

Wireless Rotary Motion Sensor
PS-3220

Wireless Temperature Link
PS-3222

Wireless Conductivity Sensor
PS-3210


Save & Share Cart
Your Shopping Cart will be saved and you'll be given a link. You, or anyone with the link, can use it to retrieve your Cart at any time.
Back Save & Share Cart
Your Shopping Cart will be saved with Product pictures and information, and Cart Totals. Then send it to yourself, or a friend, with a link to retrieve it at any time.
Your cart email sent successfully :)