Growing Tomatoes With the Greenhouse Sense & Control Kit
Over the last couple of months, AYVA Educational Solutions has been growing tomato plants from the Let’s Talk Science Tomatosphere project. In this project, you are given two unknown packets of seeds, labeled T and U. One packet of seeds have been to space, while the other has not. The purpose of this experiment is to germinate and grow the tomato plants from both packets, tracking their growth, and hypothesizing which plants are the space seeds! You can guess which ones you think are the space seeds in the survey at the bottom of this post! Submit your hypothesis and you will automatically be entered into a raffle to win a free PASCO Wireless Temperature Sensor! If you would like to find out which seeds have been to space we encourage you to participate in this fantastic program!! Sign up for your own packet of seeds here. 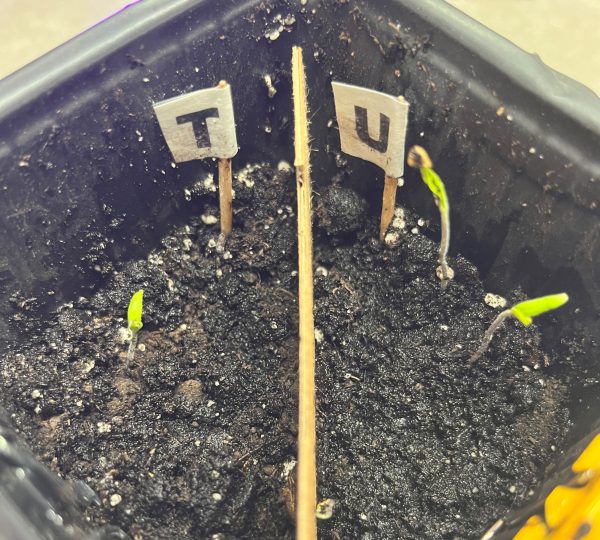
We used PASCO’s ST-2997 Greenhouse Sense and Control Kit to monitor and regulate conditions for optimal growth! By researching the optimal growing conditions for a tomato plant, we adjusted the levels of the greenhouse system to meet those needs.
Using Blockly, we block coded the Greenhouse conditions we desired, programming a 24 hour sunlight and watering cycle, and ensuring the temperature stayed at 23 degrees Celsius at all times. Once the code was exported into the //control.Node, we planted 3 seeds from each packet on the appropriate sides (T or U).
We tracked the growth of our plants from January 20th to March 31st, as they developed, they went from seeds to leafy plants.
 After just one week of being inside the Greenhouse, three out of six seeds germinated and sprouted! As a couple more weeks went by, two more seeds sprouted. Unfortunately, one seed (on the T side) did not germinate. Overall totaling three plants on the U side, two on the T side. At this point, we hypothesized which of the seeds had been to space and which had not, and wrote down our predictions to compare to the results later on. You can share your predictions in the survey at the bottom of this post, and find out which seeds were the space seeds!
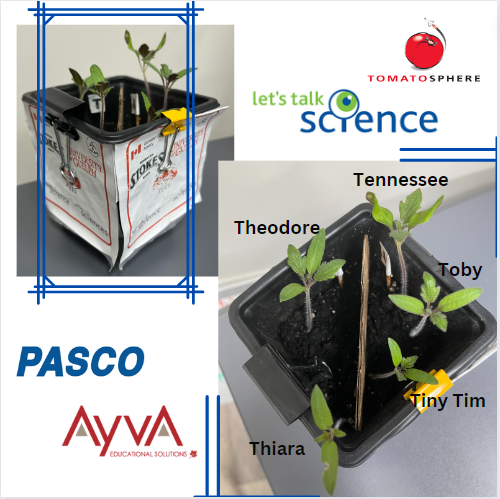
In the fourth week of growth we decided to name the plants so that they could be more easily identified, charted, and referred to. On the U side, we named the tomato plants Tennessee, Toby, and Tiny Tim. Then on the T side, we named the plants Thiara and Theodore. Tiny Tim was the smallest plant during the beginning of the growth period, while Tennessee was the largest of the seedlings. Thiara also germinated the latest of any of the seeds, excluding the one seed that never sprouted. She quickly caught up to the others though, and in the 4th week she was the 3rd tallest of them.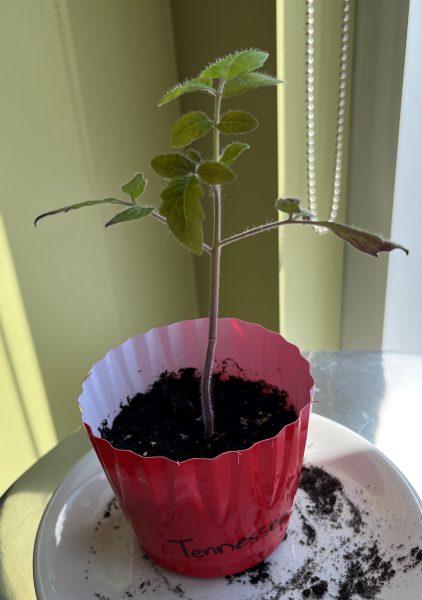
After 6 weeks of growth, the plants were beginning to falter as they combatted against one another for nutrients and water. To replenish what they lost, we decided to separate the plants. Three of the plants, Tennessee, Tiny Tim and Thiara were moved to their own pots. However, Toby and Theodore remained in the self-regulating greenhouse to continue identical conditions. Within days of separating the plants, they all began to look healthier as they received the nutrients and space that they needed.
Into the ninth week of the experiment, the plants are growing taller and broader. Now that they each have their own space, they are able to thrive. The featured photo on the right shows Tennessee healthy and strong! With no one contesting him for nutrients, he is tall, green and healthy. At this point, they are almost fully mature, and will be entering the flowering stage shortly. This week we decided to reveal the answer to the lingering question we had been wondering for months – which seeds had been to space? Was it Theodore and Thiara (T Side)? Or perhaps did Toby, Tiny Tim and Tennessee (U side) spend some time in space? Find out the answer below!
Shoutout to the PASCO Greenhouse, as this project could not have been as successful without it! The self-regulating greenhouse allowed us to grow the plants healthy and strong -with minimal intervention from us. We were able to germinate 5/6 seeds and maintain the ideal moisture and temperature levels for the plants to grow, even amidst a cold and dark winter with many days out of the office. PASCO’s Greenhouse is the perfect educational kit for your classroom, teaching students several ecological concepts such as photosynthesis, anatomy of plants, and the ways different conditions affect the growth of plants – all with the new focus and importance of coding. You can start the Tomatosphere project yourself, and facilitate it with the Greenhouse Sense and Control Kit as well.
Make sure to answer the survey below to find out which seeds have been to space and for a chance to win a PASCO Wireless Temperature Sensor! We would love to hear what you think, so share your guesses with us, and your reasoning if you have any!
Featured Products:
PASCO ST-2997 Greenhouse Sense and Control Kit

 integrating coding into the curriculum.
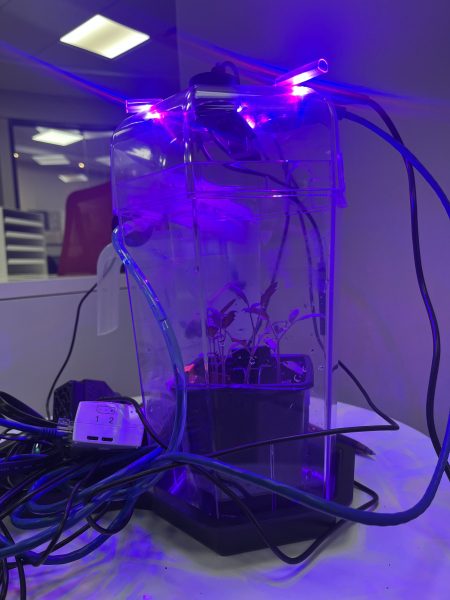
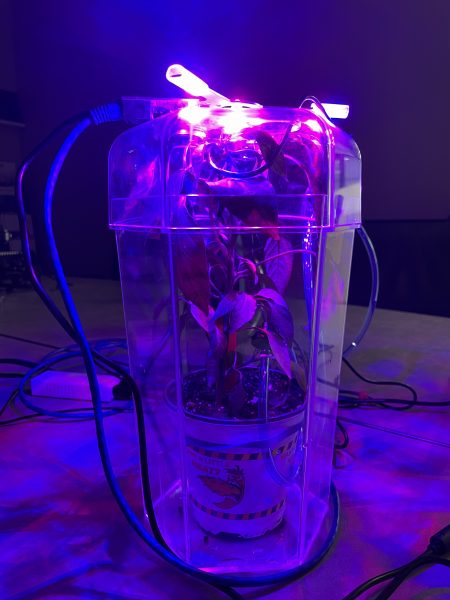 In our experience with the Greenhouse Sense & Control Kit, we decided to design an environment for a Ring of Fire Pepper Plant. We had to research conditions that would be essential for the plant to grow. This included factors such as relative humidity, temperature, soil moisture, hours of sunlight, and how much water it needs each week. The Greenhouse Sense & Control kit provides the materials for students to design the greenhouse for the plants’ needs. Through code, you can program a fan, grow light, and irrigation system to provide the optimal conditions for your plant. This teaches students how changes due to soil, water, air, and temperature in an ecosystem can affect a plant’s growth in good and bad ways. The activities provided by this kit allow students to learn about ecosystem sustainability firsthand and in real-time.

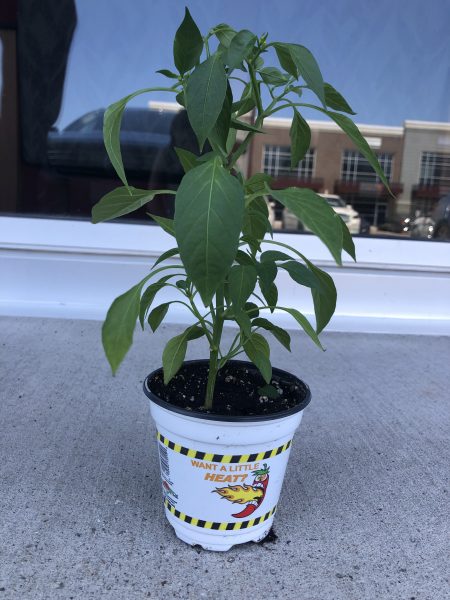 For the past week, Mia and I have been working on a new project involving a pepper plant named Pete, the SPARKvue software, and PASCO’s new Greenhouse Sense and Control Kit. Pete is a Ring of Fire pepper plant which thrives in temperatures between 26-29 degrees Celsius and a relative humidity of around 70%. We knew that we had to set up Pete’s optimal conditions if we wanted him to grow and produce any peppers, so Mia and I immediately got to work on it. We started by setting up the greenhouse itself, including the fan and grow light accessories, followed by the greenhouse sensor which includes a soil moisture probe and the temperature, humidity, and light sensing pc board. Once we connected the //control.Node to our laptop we were able to begin the programming process. Using the information available on the PASCO website, we were able to create simple code designed to regulate the temperature and relative humidity by activating the fan accessory anytime the relative humidity level went over 75% and deactivating the fan accessory once the level drops back down to 70%. This would keep the relative humidity within the desired 70-75% window. We also found that this would keep the temperature of the greenhouse between 25-26 degrees Celsius, ensuring that ideal conditions for the Ring of Fire pepper were met.
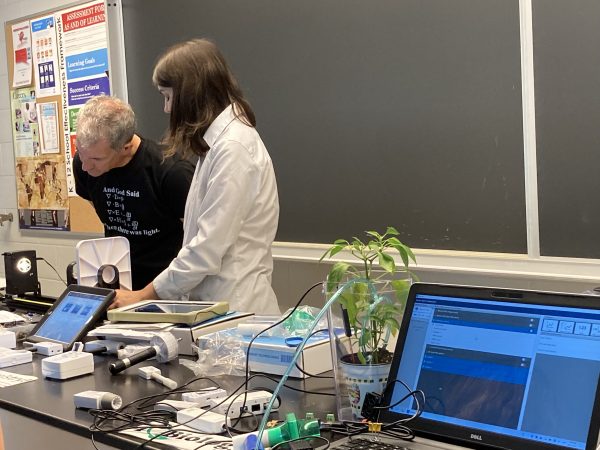 It was great to be back in person interacting with teachers! We discussed ways to integrate PASCO products into the classroom to create a fun, educational, and hands-on environment for students.
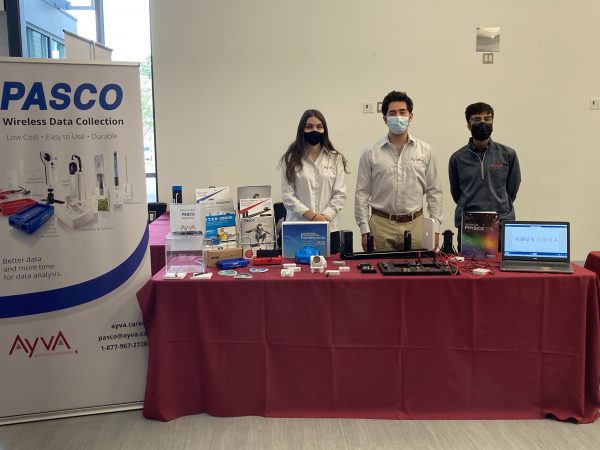
 Extension: Vector Display
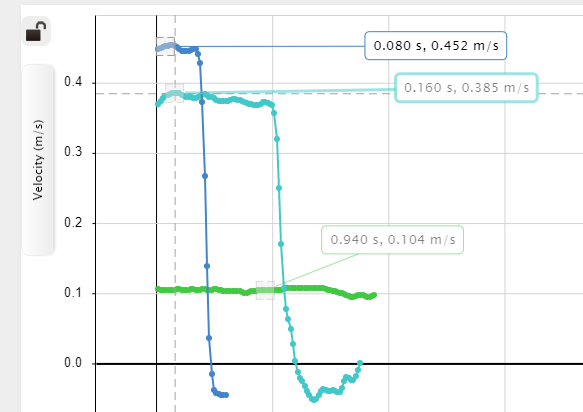
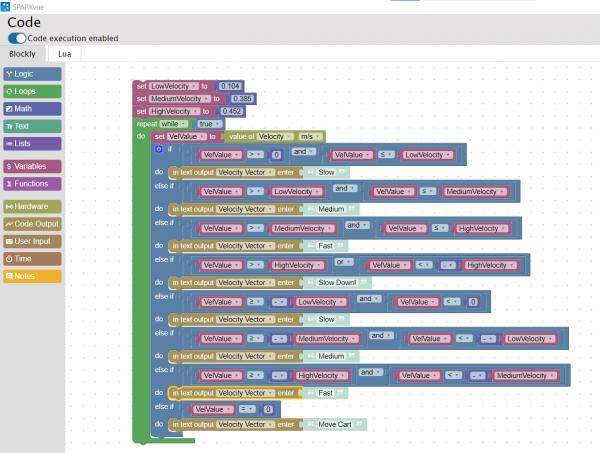 the ones I recorded, as shown in the image on the left. I tested my code by clicking start and moving the Smart Cart. At first, I was not sure where to look for the displayed text. I realized I had to change my display from a graph to digits. Then, by clicking the variable being displayed, I switched from Sensors to User-entered and chose Velocity Vector (the variable I created in the Blockly code). This time when I pressed start, the vectors I assigned to each velocity displayed on the screen depending on the Smart Cart’s speed. I decided to change the text displayed from vectors to words. As shown in the video below, I used simple terms such as slow, medium, and fast to describe the carts’ velocities.
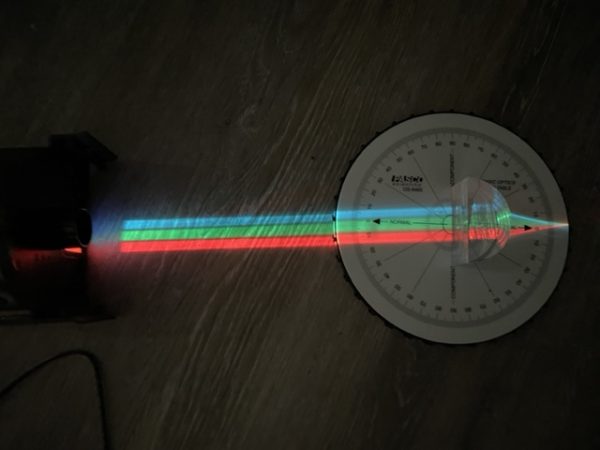 we used the Ray Table, the D-Shaped Lens, and the Light Source to perform a simple refraction experiment, using the PASCO Refraction lab as guidance as shown in the image on the left. This experiment was very easy to set up. All you need to do is plug in the Light Source and follow the instructions in the Refraction lab document. This experiment explores Snell’s Law, describing the relationship between angles of incidence and refraction.
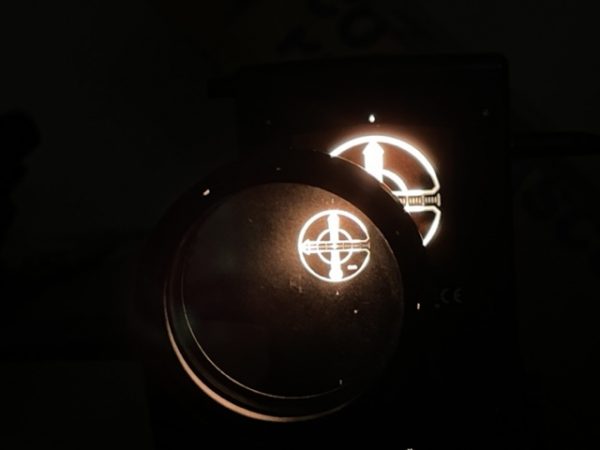
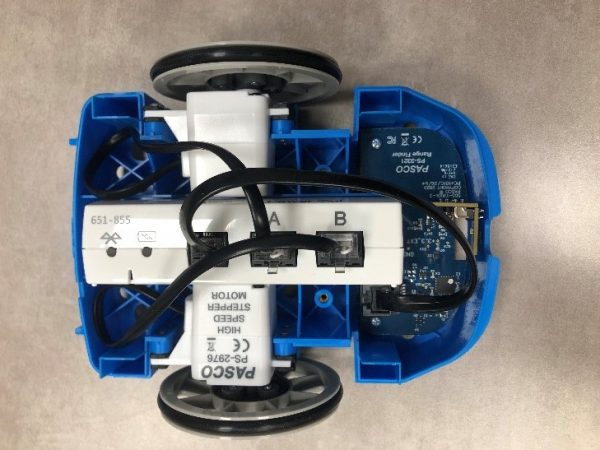
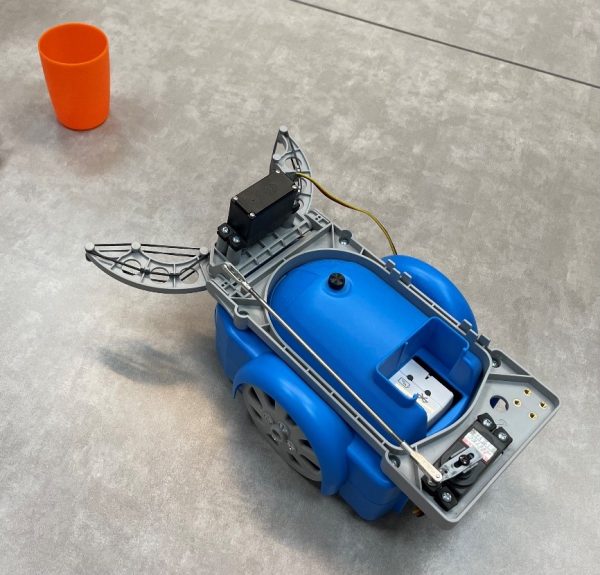
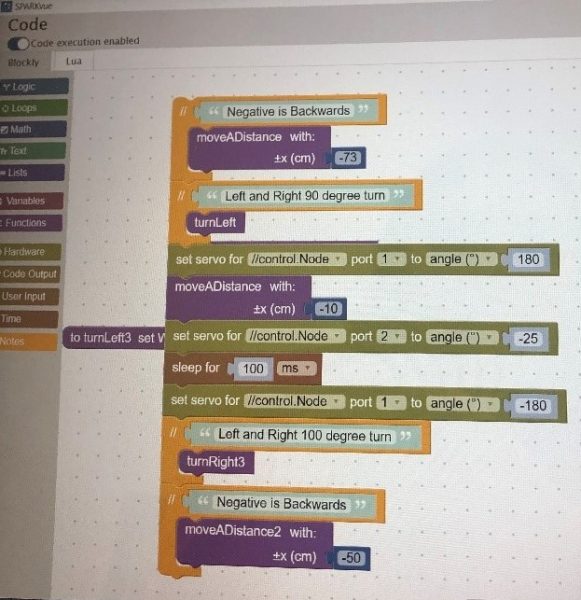 This inspired us to film a short clip in which the PASCObot would move a certain distance, turn left, grab a cup of water, turn right, and bring this cup to us. We started by measuring and marking a course then coding the robot using the measurements taken, as shown in the image on the right. We were able to successfully complete this task without spilling any water, and this allowed us to become more familiar with the system.
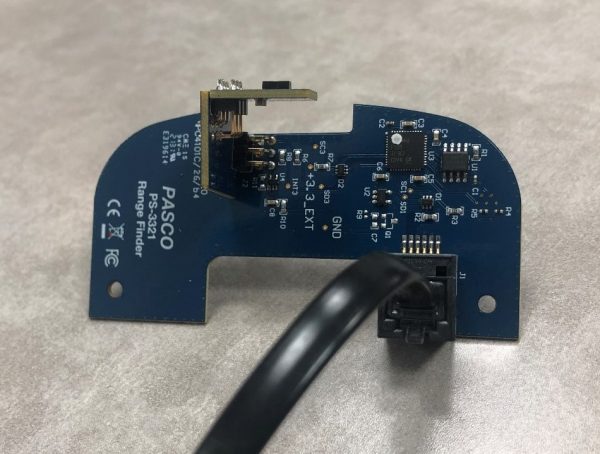 We then moved on to using the Range Finder Module, shown in the image on the left. This accessory was attached in the front of the PASCObot with two screws. A wire was then used to connect the Range Finder Module to the //control.node. The Range Finder Module uses infrared light to detect the distance from the PASCObot to objects. We followed the “Roving with Sight with the PASCObot” experiment from the PASCO Experiment Library and used the sample code. The code allowed the PASCObot to move on its own, avoiding objects, reacting to its surroundings, and maneuvering around the office floor independently. We found working with the PASCObot super cool and we are excited to try out more experiments.