
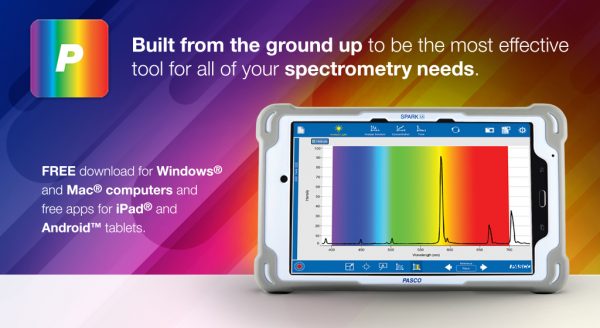


The PASCO Wireless Spectrometer
Simply put, constructivism is a theory of knowledge that argues that humans generate knowledge and meaning from an interaction between their experiences and their ideas. So it follows that nothing is can be more constructivist than exploring the theoretical with real-time tools that measure the invisible. And the PASCO Wireless Spectrometer is just such a tool.
One of the most amazing things about the PASCO Wireless Spectrometer is that it does exactly what you would want it to do; show you the invisible with ease, simplicity, and leave behind a useful digital paper trail of graphs and charts. Although the main purpose of the PASCO Wireless Spectrometer was “specifically designed for introductory spectroscopy experiments” it actually goes farther than that. Much farther. Much much farther!
This trio of teachers, two from China and one from Mongolia have limited English speaking skills, but instantly understood the iPad app and PASCO Wireless Spectrometer. Seems that light is also a universal language.
The physics and electronics behind the PASCO Wireless Spectrometer are straight forward. The output is clear and obvious. And the mobility aspect is unprecedented. In other words, it does what it should how it should. Amazing enough on its own, but in true paradigm shifting fashion the PASCO Wireless Spectrometer presents the invisible world of visible light in the magical cartoon chart we’ve seen only in static textbooks for most of our lives. It’s as if the dinosaur skeletons in dusty museums suddenly came alive and reacted to the world.
Visible light, or the light our human eyes sense and convert to electrical impulses to our brains, only encompass a tiny fraction of the electromagnetic spectrum. Wavelengths between 390-700 nanometers, or from the short blue/violet waves to the longer orange/red ones with green and yellow in the middle. Infrared waves are just a little too long for us to see, and ultraviolet ones are a little too short. Even longer are radio waves, and even shorter are x-rays. The PASCO Wireless Spectrometer has a range of 380 to 950 nanometers meaning it can “see” a little into the ultraviolet and a lot into the infrared.
An ultraviolet light spikes the graph just outside the shortest wavelength we can see with our eyes.
Where this all comes together is that when the PASCO Wireless Spectrometer and various light sources are manipulated with our hands, the extended visible spectrum becomes something we can explore with the same cognitive dexterity as the microscope affords us in biology. When used in the classroom for demonstrations and explorations, the PASCO Wireless Spectrometer literally lets “humans generate knowledge and meaning from an interaction between their experiences and their ideas.” So yes, the PASCO Wireless Spectrometer is the epitome of constructivist theory into educational practice.
Isaac Newton
Although Isaac Newton is credited with discovering the inner workings of visible light back in the latter 1600s, the basic concept behind a rainbow was suggested by Roger Bacon 400 years earlier who in turn drew upon the works of Claudius Ptolemy a millennium before, and even Aristotle another 300 years before that.
Roger Bacon
Claudius Ptolemy
Aristotle
As a quick digression here, the Newtonian physics behind the PASCO Wireless Spectrometer has roots much more than five times deeper into the past than Mr. Newton’s distance in time is from us right now. Sorry to go all Einstein on you, but the individual colors of visible light that Newton coaxed out of sunlight with only a glass triangle, and then reassembled with nothing more than a companion prism was like yesterday. Yet the attempts to explain the phenomena were first floated last week.
And now to think that within the palm of a student’s hand and the screen of their iPad is a gift of knowledge as great as the discovery itself. A stretch? Perhaps, but unless a scientific concept can be truly understood to the point one can make personal meaning out of the discovery, memorized facts are little more than coins used to buy grades.
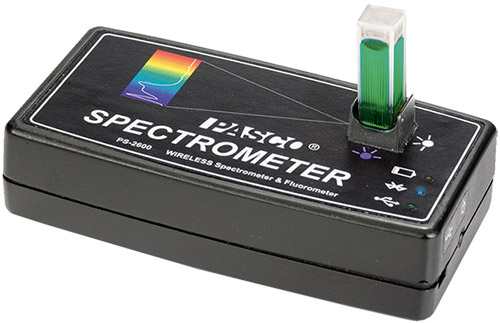
Technically speaking, the PASCO Wireless Spectrometer is a battery operated spectrometer that uses Bluetooth wireless or a USB wire in order to communicate with a computing device running the necessary software. With its own built-in LED-boosted tungsten light source and three nanometer resolution, the PASCO Wireless Spectrometer provides an exceptional tool for traditional experimentation with pl
enty of room left over to inspect rarely explored specimens of light scattered throughout our lives.
enty of room left over to inspect rarely explored specimens of light scattered throughout our lives.
The operation of PASCO’s unassuming black brick puts the power of spectrometry into the hands of grade school students and Ph.D. candidates alike. While maybe not the most durable block in the scientific toy box, the PASCO Wireless Spectrometer does offer a level of simplicity (when desired) as easy to use as glass prism and sunlight. Of course you can do much more with the PASCO Wireless Spectrometer, but you don’t have to in order to get your money’s worth. This spectrometer does so much so well so easily that it literally rewrites lesson plans just by walking into the classroom.
On a higher level, the PASCO Wireless Spectrometer can be used in chemical experiments of intensity, absorbance, transmittance and fluorescence all while using a device that, according to PASCO, has light pass through the solution and a diffraction grating and then a CCD array detects the light for collection and analysis. Sounds simple enough just like a digital prism should. Except this one gives about nine hours of service per battery charge.
In the off chance that the battery fails, it is user-replaceable. in the off chance the light burns out, it is user-replaceable. And in the likely chance that liquid from a cuvette spills into the holder, a drain hole limits the damage, and cleaning the holder is user-serviceable with a cotton swab and deionized water.
A portable studio light is used to provide a background of predictable photons in order to explore the absorbance properties of various types of matter including sunglasses, polarizers, fabric, and theater lighting filters.
The PASCO Wireless Spectrometer must interface with a computer or tablet. Both Mac and Windows are supported as is iOS and Android.
You can download the Spectrometer user guide here.
PASCO also suggests using the Wireless Spectrometer for the following popular labs:
- Absorbance and transmittance spectra
- Beer’s Law: concentration and absorbance
- Kinetics
- Fluorescence
- Photosynthesis with DPIP
- Absorption spectra of plant pigments
- Concentration of proteins in solution
- Rate of enzyme-catalyzed reactions
- Growth of cell cultures
- Light intensity across the visible spectrum
- Emission spectra of light sources
- Match known spectra with references
And PASCO also provides several sample labs for plug-and-play directly into the chemistry classroom. But the really exciting plug-and-play option is the accessory fiber optic probe. With no more effort than sliding a faux cuvette into the receiving slot on the spectrometer, a meter-long fiber cord moves a directional sensor out into the wild where it can capture photons from all kinds critters. Some of my favorite animals include UV lights, filtered lightbulbs, various school lighting sources, sunlight though sunglasses, polarizers, and pretty much any LED flashlight I can find, especially the really good ones.
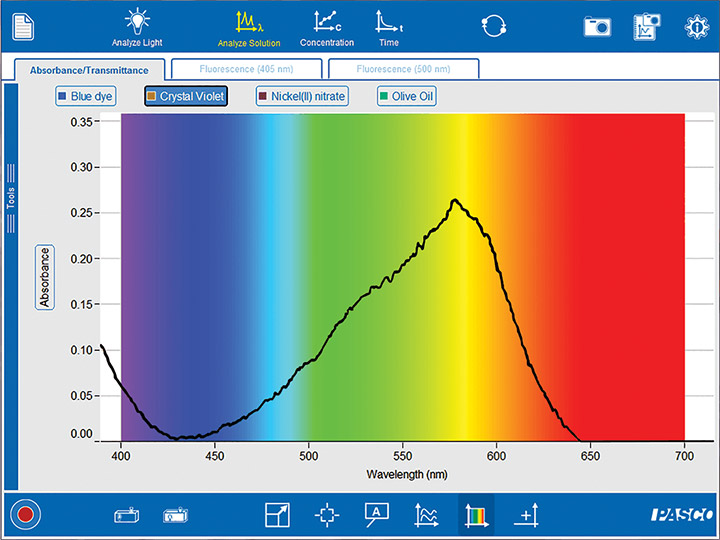
Although the screen output from the PASCO Wireless Spectrometer’s software is a graphical representation of a physical property, it takes almost no mental gymnastics to understand the changes to the graph once your mind is oriented to the display. The color-coded background and gesture-ready scaling provides an exceptionally smooth relationship with the data to the point all the hardware and software disappear leaving only the experiment and the results. And in my book, that kind of invisibility is the true measure of success with a teaching product.
When teaching the next generation about the important discoveries of the past generations, we have an obligation to use the most powerful educational tools possible. The PASCO Wireless Spectrometer is truly 100% pure constructivism-in-a-box. It turns experiences and ideas into personal meaning. Battery included and no wires necessary.
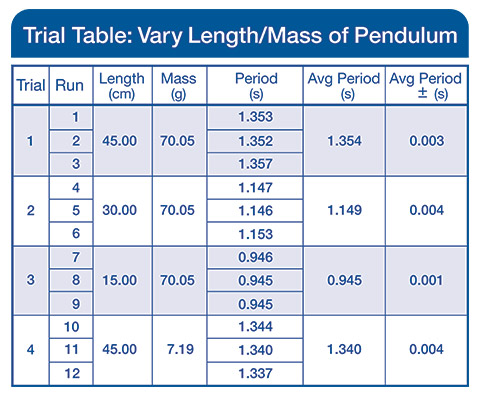 You never take only one run in science. You take multiple runs and calculate averages. Next, you vary a parameter while holding the other constant; again, taking more runs and calculating averages. Most software data tables don’t actually allow this to be done easily.
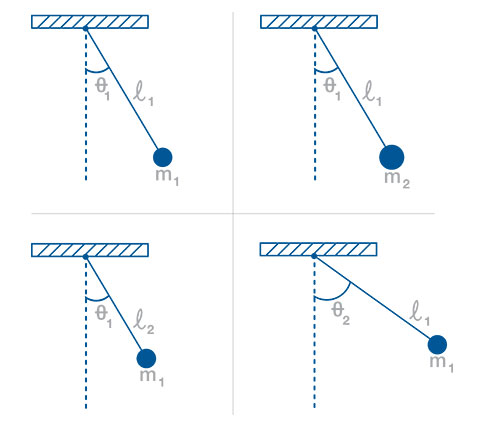 Using the simple pendulum lab as an example, students will time a simple pendulum under various conditions. They will vary the mass, length, and starting angle. The Capstone Trials Table allows you to vary and keep track of experimental parameters between trials and runs taken in each trial. You can also keep track of statistics for averaged runs and experimental error.
 Gravity