English Français

1-877-967-2726

Exploring 2-Dimentional Motion and Vectors with Capstone’s Video Analysis Feature

Capstone includes a very powerful video analysis feature which can be used for comprehensive analysis of moving objects as well as to improve understanding.  Short video clips from your smartphone can be easily imported and analysed with a range of tools.  The movement of objects with a high contrast to a uniform background can be automatically tracked by the software.


A ball will be thrown in a parabolic arc and various tools will be used to analyze the motion.  Note that the vertical and horizontal axes have been marked and a distance of 4.00 m has been measured.  This will enable the software to translate from pixels to m:


As part of the analysis, the position of the ball in each frame is marked and the result is as shown below:

It is now possible to have the software generate various graphs such as position vs time and velocity vs time.

A graph of vertical position vs time is as shown below:

A graph of horizontal position vs time yields the following:

A graph of the vertical component of velocity vs time yields the following result:

Capstone also includes tools that improve understanding.  For example, in the screen below, the vertical and horizontal components of velocity are shown for the ball as it flies through the air.

To make the display less cluttered and less confusing it is possible to mark the vectors at an interval other than every frame.  Below the vectors are shown every third frame:

It is also possible to have a single vertical vector and a single horizontal vector appear and move with the ball as it goes through the air.


It is also possible to show the acceleration vector as shown below:

The fact that a few vectors do not point directly down is likely due to minor errors made when marking the position of the ball in various frames with a mouse.

Tips for sanitizing your PASCO products

PASCO products are made with a variety of materials, and each material might have specific cleaning requirements. The following applies to all products:

  • Unplug all external power cables and devices before attempting to clean a product.
  • Only use alcohol based disinfectants.  Take care to use these cleaning solutions far from any ignition sources.
  • Never spray cleaners directly onto a product or put liquids directly onto a product. Always use a damp cloth.
  • Do not overly saturate the cloth. Don’t get moisture into any openings.
  • Don’t submerge any product in any cleaning agents.
  • Don’t use aerosol sprays, bleach, ammonia based solutions, or abrasives.
  • Don’t use on fabric or leather surfaces.

Using a 70 percent isopropyl alcohol wipe or mix or Clorox Disinfecting Wipes is generally safe. You may gently wipe the hard, nonporous surfaces of your PASCO product, such as the display, buttons, or other exterior surfaces.

Warranty: Liquid damage or damage cause by harsh (unauthorized) chemicals or cleaning methods is not covered under the PASCO product warranty. For any concerns or questions in regard to cleaning a specific PASCO product, please contact PASCO Technical Support for further guidance.

PASCO Day of Physics – July 24, 2020

Session 1

Session 2

Session 3

Session 4

Session 5: Cool Physics Demos

  • Coupled Oscillators Smart Cart (FFT) & Friction Block+PAScar
  • Inertia Wands
  • Atmospheric pressure Demos
  • Polarizer Demo / Color Mixer / Color Mixer Accessory
  • Genecon Hand Crank Generator Coil & cow magnet on a spring
  • Eddy Currents – magnetic braking
  • Mirror pendulum demo

SPARKVUE – A resource for planning lessons during the pandemic!

With SPARKvue it is possible for teachers to collect data and steam the data to students in real time via a student device also running SPARKvue. This is possible if each device has SPARKvue loaded on it and is connected to WiFi – even if the devices are located many kms apart. So a teacher could schedule a zoom session with his/her students. Students could use a computer for this activity. The teacher could then carry out an activity on another device loaded with SPARKvue and stream this to students who would have a second device such as a tablet, chromebook or smart phone to receive the data. After using the zoom platform for some preliminary discussion the teacher could then turn control of the data over to each individual student and this student could then use all of the tools available to him/her in SPARKvue to carry out the analysis.

Has it been difficult for you to plan lessons for your students that would result in meaningful learning as they tackled them at home?

SPARKvue data collection software can be a great help here for several reasons:

  •  SPARKvue will run on a great variety of devices including smart phones, tablets, chromebooks, and computers. It is free for all of these devices except for computers, for which a license must be purchased.
  • The appearance and function of SPARKvue software is virtually identical ascross platforms.
    • An activity planned and carried out and saved on one device such as a tablet can be opened in another device such as a chromebook.
    • All of Pasco’s sensors can be used with any of these devices

  • Unlike the software of some of our competitors, it is possible to generate a number of pages in SPARKvue (actually there is no limit). This makes it possible to use a number of the displays available in SPARKvue such as a digital picture, a video clip, a graph, a table, a meter, a digital display, an assessment, a text box, and blockly coding.
  • A teacher could design and carry out an activity where most of the analysis is left for the student to complete. For example the sequence of pages could look as follows:
    • The opening page is a title page and gives a brief description of the task to be completed
    • Page 2 shows a digital photograph of the setup to be used
    • Page 3 contains a short video clip in which the teacher gives a brief explanation or where a specific technique is demonstrated – eg how to connect a pressure sensor to a syringe (for a Boyle’s Law activity).
    • Page 4 is a text box which informs students that a data run has been collected by the teacher and the following pages will instruct them how to analyze the results. For example on page 5 the page is split into two parts with the larger part on the left. Students are asked to generate a graph of the data. On the right side there are a number of questions which students must answer by analyzing the graph. This means that the students will have to know how to use the analysis tools found as part of the graph display.
    • On page 6 students could find another split page. Suppose a motion sensor was used to collect data. On the left side students could be asked to plot a graph of kinetic energy vs time. This means they would have to know how to use the calculator in SPARKvue. On the right side of the page there could be a number of questions relating to this graph.
  • SPARKvue can collect data from more than one sensor at a time. For example, an activity could be carried out in which the pH and temperature of a sample of orange juice is measured when AlkaSeltzer is added. Students could be asked to generate a graph showing both the temperature and pH of the juice as the reaction proceeds and then be asked a series of questions on this reaction.
    • As can be seen from the examples above SPARKvue can be used to carry out extensive analysis of collected data.

PASCO Live June 25th at 3PM EST:
Materials Testing System: Beyond Load-Displacement Curves

Join PASCO on Thursday, June 25th for a Special Edition of PASCO Live!
Materials Testing System: Beyond Load-Displacement Curves
June 25, 2020 at 3:00 – 4:00 pm EST / 12:00 – 1:00 pm PST

Host Mike Paskowitz will be demonstrating live experiments using his favourite PASCO product, the Materials Testing System. Mike will take you beyond simple load-displacement curves using a thermal camera, microscope, and video analysis to complete in-depth sample analysis. Don’t miss your chance to participate in this live investigation of sample tension and bending.

The PASCO Materials Testing System(MTS) includes everything needed to do tensile testing straight out of the box. With 6 different versions there are options to fit every budget! The educationally designed MTS is ideal for kinesthetic learning as the manually driven crank enables students to “feel” the strength of the material. Students can accurately & easily test material compression, column buckling, shearing, three and four-point bending, photo-elasticity, cyclic deformation & more.


PASCO Wins Three “Best of Show” Awards from NSTA and Catapult-X

Wireless Smart Cart, Wireless Spectrometer, and Wireless Weather Sensor


We are pleased to announce that PASCO has been awarded three “Best of Show” awards! More than two thousand science and STEM educators participated in the first Science Educators’ Best of Show™ Awards by casting their votes for products that they felt impacted science learning. We are honored to have our products recognized in a competition designed by science educators for science educators. You can check out the winners below!

Category: Best New Technology Innovation for STEM
Winner: PASCO’s Wireless Smart Cart and Accessories
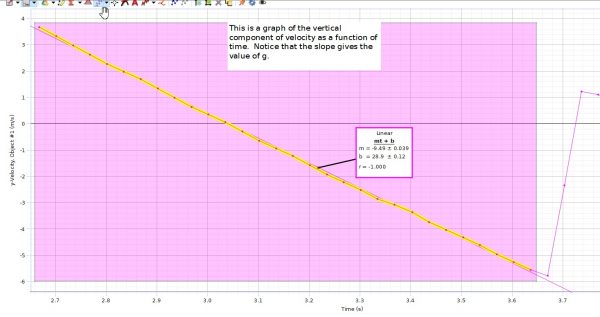
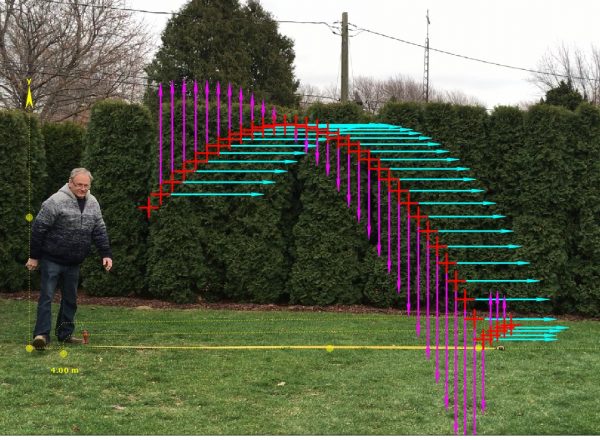
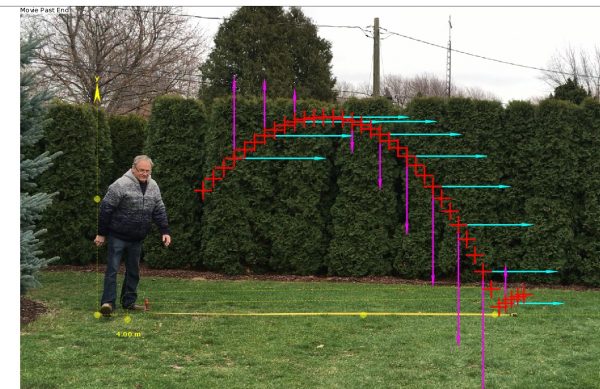
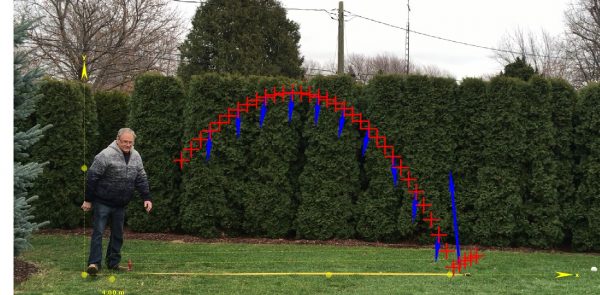
When physics educators combine the PASCO Wireless Smart Cart with the available accessories, they have a complete platform for demonstrating some of the toughest topics in mechanics. The Smart Cart’s ease of use and extensive capabilities allow students to perform their mechanics labs to a high degree of accuracy and repeatability. With sensors for position, velocity, acceleration, force, and rotation, the Wireless Smart Cart relays live data to help students test their understanding of mechanics in real time.

The wireless nature of the PASCO Wireless Smart Cart and Accessories is a definite improvement [over traditional systems]. The removal of wires needed to connect to an external interface makes data more accurate and opens up opportunity for more innovative experimentation. The accessories for the carts also are very innovative and extend the scope of investigation.

— Science Educators’ Best of Show Judge

Category: Best Tried & True Technology Teaching and Learning: Chemistry
Winner: The Wireless Spectrometer and Spectrometry software
With measurements for emission spectra, intensity, absorbance, transmittance, and fluorescence, the Wireless Spectrometer is surely more powerful than its size suggests. Its visual, user-centered design makes it easy for educators and leaners of all levels to integrate spectrometry into their learning. The key is PASCO’s Spectrometry software, which allows students to quickly generate standard curves, make comparisons, and analyze their results using its visual absorbance display. When combined, the Wireless Spectrometer and Spectrometry software provide educators with a classroom-friendly spectrometry solution that can be applied to a wide variety of chemistry topics.

This device provides advanced analysis potential of spectrum analysis for chemistry, environmental and physics classes that is quite rare for high school classes to experience. The data collection is quick and thorough with excellent software for analysis on many devices. Use of this device and software will enhance learning in many science courses.

— Science Educators’ Best of Show Judge

Category: Best Tried & True Technology Teaching and Learning: Environmental Science
Winner: The Wireless Weather Sensor and SPARKvue software
With more than nineteen different measurements, including GPS, the Wireless Weather Sensor supports real-world environmental investigations that relate phenomena to data collection and analysis within SPARKvue. Together, the Wireless Weather Sensor and weather features within SPARKvue create a coherent solution for performing both long-term and short-term environmental inquiry at any science level. The Weather Dashboard within SPARKvue intuitively displays live and logged data, while SPARKvue’s ArcView GIS mapping integration supports geospatial investigations and analysis.

This sensor would provide extra opportunities for data collection in environmental science. It does offer a variety of options for experimental situations-19 in all. Experiments can be of short duration or long term. The weather vane is mentioned as an extra device to enhance data collection.

— Science Educators’ Best of Show Judge


Essential Physics & Essential Chemistry Access Codes

To support educators and students as they transition to remote learning during the COVID-19 school closures, we are granting free access to the Essential Physics 3rd Edition Student e-Book and Teacher e-Resources for the remainder of the 2020 school year. The Student e-Book includes a full year of curriculum that can be used for high school, AP, IB, and algebra-based courses.

To request your teacher access code please complete the form below.

Essential Physics & Essential Chemistry Teacher Guides


Please Select: *


Is Sound Just Vibrations?

When we consider what defines sound in a physics context, it can be tempting to assume sound is just vibrations. While partially true, sound is much more complex than simple vibrations. When a sound source vibrates, it produces sound energy that travels through particle disturbances in the medium, effectively transmitting the sound. As a sound wave moves through a medium, it creates high and low pressure differences called rarefactions and compressions. These differences are the result of particles within the medium shifting from their original states and causing other particles to compress or expand as a result. While a vibrating source creates sound energy, pressure differences make up the sound wave. Specific patterns of rarefactions and compressions are what give sounds their distinct characteristics, and ultimately, allow us to differentiate between noises, melodies, and other sounds. Looking for more information on sound? Visit our Sound Waves information guide for a more in-depth look at sound, or read our other sound blog posts, “What Type of Wave is Sound?

Who Discovered Spectroscopy?

Similar to many scientific concepts, spectroscopy developed as a result of the cumulative work of many scientists over many decades. Generally, Sir Isaac Newton is credited with the discovery of spectroscopy, but his work wouldn’t have been possible without the discoveries made by others before him. Newton’s optics experiments, which were conducted from 1666 to 1672, were built on foundations created by Athanasius Kircher (1646), Jan Marek Marci (1648), Robert Boyle (1664), and Francesco Maria Grimaldi (1665). In his theoretical explanation, “Optics,” Newton described prism experiments that split white light into colored components, which he named the “spectrum.” Newton’s prism experiments were pivotal in the discovery of spectroscopy, but the first spectrometer wasn’t created until 1802 when William Hyde Wollaston improved upon Newton’s model.

William Hyde Wollaston’s spectrometer included a lens that focused the Sun’s spectrum on a screen. He quickly noticed that the spectrum was missing sections of color. Even more troublesome, the gaps were inconsistent. Wollaston claimed these lines to be natural boundaries between the colors, but this hypothesis was later corrected by Joseph von Fraunhofer in 1815.

Joseph von Fraunhofer’s experiments replaced Newton’s prism with a diffraction grating to serve as the source of wavelength dispersion. Based on the theories of light interference developed by François Arago, Augustin-Jean Fresnel, and Thomas Young, Fraunhofer’s experiments featured an improved spectral resolution and demonstrated the effect of light passing through a single rectangular slit, two slits, and multiple, closely spaced slits. Fraunhofer’s experiments allowed him to quantify the dispersed wavelengths created by his diffraction grating. Today, the dark bands Fraunhofer observed and their specific wavelengths are still referred to as Fraunhofer lines.

Throughout the mid 1800’s, scientists began to make important connections between emission spectra and absorption and emission lines. Among these scientists were Swedish physicist Anders Jonas Ångström, George Stokes, David Atler, and William Thomson (Kelvin). In the 1860’s, Bunsen and Kirchhoff discovered that Fraunhofer lines correspond to emission spectral lines observed in laboratory light sources. Using systematic observations and detailed spectral examinations, they became the first to establish links between chemical elements and their unique spectral patterns.

It took many decades and more than a dozen scientists for spectroscopy to be well understood, and most modern models weren’t developed until the 1900’s. Today, there are physicists, biologists, and chemists using spectroscopy in their day-to-day lives. For more information, visit our in-depth guide, What is Spectroscopy? or check out our other blog post, “What is the Difference Between Spectroscopy and Microscopy?”

PASCO’s 2020 Global Partner Meeting

Last week saw delegates from more than 40 different countries gather at PASCO’s head office in California to share success stories about how educators are using PASCO solutions to acheive their STEM goals. I was excited to see several new pieces of equipment including sensors for all sciences.

Wireless Sound Sensor (PS-3227)
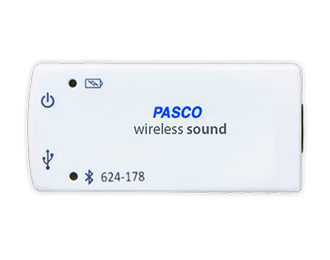
This is a wireless Bluetooth sensor that connects to any device loaded with either Sparkvue or Capstone software. As is the case with other Pasco wireless sensors this sensor is more powerful than the older sensor it replaces. It can be used to measure sound levels in decibels as well as to show the waveform of a sound in addition to an FFT display to show the frequencies present.

In the recent past when I have worked with teachers to design a physics lab most of the sensor requirements can be filled by Pasco’s new line of wireless sensors, including the smart cart. I then recommend that they consider purchasing at least one 550 or 850 universal interface so that they can use the ScienceWorkshop sound sensor to study sound waves and FFT displays. In addition the built-in signal generator will allow them to generate sine waves over a large frequency range. The AC/DC module described below can carry out this signal generator function. Thus, purchasing the wireless sound sensor and the wireless AC/DC module much of the work formerly left to the 550 can now be accomplished by the less expensive wireless units.

Wireless AC/DC Module (EM-3533)
This wireless module connects via Bluetooth to any device loaded with Capstone or Sparkvue. It connects nicely with other modules in the modular electricity package giving teachers the choice of using this rather than purchasing batteries.


As shown in the video this unit can produce DC output as well as sine, triangle and square waves.

Blockly Coding
The most recent versions of Capstone and SPARKvue include the ability to carry out Blockly coding. This coding can be used to control connected sensors and to react to measurements that they are making. It introduces students to coding as they use sensors to explore various science topics. It exposes them to logic that they are likely to encounter later in life if they pursue science and/or technology and so it becomes an important part of the STEM experience we try to generate for our students.


To make it easier to introduce students to Blockly coding PASCO has developed the //code.Node (PS-3231). It includes the following built–in sensors: magnetic, motion, light, temperature, and sound.

Bill Konrad is a former Teacher and Science/Technology Consultant in South Western Ontario and currently supports AYVA’s customers as a PASCO Product Specialist. Details on how to reach Bill directly can be found here.

Save & Share Cart
Your Shopping Cart will be saved and you'll be given a link. You, or anyone with the link, can use it to retrieve your Cart at any time.
Back Save & Share Cart
Your Shopping Cart will be saved with Product pictures and information, and Cart Totals. Then send it to yourself, or a friend, with a link to retrieve it at any time.
Your cart email sent successfully :)