|
|
|
|
| B: Good, |
|
|
| C: Fair to Poor, |
|
|
| D: Not recommended |
|
|
|
|
|
| Chemical |
304 Stainless Steel (PS-2153) |
316 Stainless Steel (PS-3201) |
| Acetaldehyde |
A |
A |
| Acetamide |
D |
A |
| Acetate Solvents |
D |
A |
| Acetic Acid |
D |
B |
| Acetic Acid — 20% |
B |
A |
| Acetic Acid — 80% |
D |
B |
| Acetic Acid — Glacial |
C |
A |
| Acetic Anhydride |
D |
B |
| Acetone |
A |
A |
| Acetone 70°F |
A |
A |
| Acetonitrile (Methyl Cyanide) |
A |
A |
| Acetophenone |
A |
B |
| Acetyl Chloride |
B |
B |
| Acetylene |
A |
A |
| Acrylonitrile |
A |
A |
| Adipic Acid |
B |
B |
| Aero Lubriplate |
A |
A |
| Aerosafe 2300 |
A |
A |
| Aerosafe 2300F |
A |
A |
| Aeroshell 17 Grease |
A |
A |
| Aeroshell 1Ac |
A |
A |
| Aeroshell 750 |
A |
A |
| Aeroshell 7A Grease |
A |
A |
| Alcohol |
A |
A |
| Alcohol: Amyl |
A |
A |
| Alcohol: Benzyl |
B |
B |
| Alcohol: Butyl |
A |
A |
| Alcohol: Diacetone |
A |
A |
| Alcohol: Ethyl |
A |
A |
| Alcohol: Hexyl |
A |
A |
| Alcohol: Isobutyl |
A |
A |
| Alcohol: Isopropyl |
B |
B |
| Alcohol: Methyl |
A |
A |
| Alcohol: Octyl |
A |
A |
| Alcohol: Propyl |
A |
A |
| Alkaline Solutions |
A |
A |
| Allyl Alcohol |
A |
A |
| Allyl Chloride |
B |
B |
| Almond Oil (Artificial) |
B |
B |
| Aluminum Acetate (Burow’s Solution) |
C |
B |
| Aluminum Chloride |
D |
C |
| Aluminum Chloride 20% |
D |
C |
| Aluminum Fluoride |
D |
D |
| Aluminum Hydroxide |
B |
C |
| Aluminum Nitrate |
A |
A |
| Aluminum Phosphate |
A |
A |
| Aluminum Potassium Sulfate |
D |
B |
| Aluminum Potassium Sulfate 10% |
A |
A |
| Aluminum Sulfate |
B |
B |
| Amines |
A |
A |
| Ammonia 10% |
A |
A |
| Ammonia Anhydrous |
A |
A |
| Ammonia Nitrate |
A |
A |
| Ammonia, anhydrous |
B |
A |
| Ammonium Acetate |
B |
A |
| Ammonium Bifluoride |
D |
B |
| Ammonium Carbonate |
B |
B |
| Ammonium Casenite |
A |
A |
| Ammonium Chloride |
C |
C |
| Ammonium Fluoride |
D |
A |
| Ammonium Hydroxide |
B |
A |
| Ammonium Nitrate |
A |
A |
| Ammonium Oxalate |
A |
A |
| Ammonium Persulfate |
A |
B |
| Ammonium Phosphate |
A |
A |
| Ammonium Phosphate, Dibasic |
B |
C |
| Ammonium Phosphate, Monobasic |
B |
C |
| Ammonium Phosphate, Tribasic |
B |
B |
| Ammonium Sulfate |
B |
B |
| Ammonium Sulfite |
B |
B |
| Ammonium Thiosulfate |
A |
A |
| Amyl Acetate (Banana Oil) |
A |
A |
| Amyl Alcohol |
A |
A |
| Amyl Chloride (Chloropentane) |
A |
A |
| Aniline |
A |
B |
| Aniline Dyes |
B |
B |
| Aniline Hydrochloride |
D |
D |
| Animal Fats & Oils |
A |
A |
| Anti-Freeze (Alcohol Base) |
A |
A |
| Anti-Freeze (Glycol Base) |
A |
A |
| Antimony Trichloride |
D |
D |
| Aqua Regia (80%, Hci, 20% Hno3) |
D |
D |
| Arochlor 1248 |
B |
B |
| Aroclor |
B |
B |
| Aromatic Hydrocarbons |
A |
C |
| Arsenic Acid |
B |
A |
| Arsenic Trichloride |
D |
D |
| Asphalt |
B |
A |
| Asphalt Emulsions |
A |
A |
| Atmosphere, Industrial |
B |
A |
| Automatic Brake Fluid |
A |
A |
| Automatic Transmission Fluid |
A |
A |
| Automotive Gasoline (Standard) |
A |
A |
| Aviation Gasoline |
A |
A |
| Banana Oil |
A |
A |
| Barbeque Sauce |
A |
A |
| Barium Carbonate |
B |
B |
| Barium Chloride |
B |
C |
| Barium Cyanide |
A |
A |
| Barium Hydroxide |
B |
B |
| Barium Nitrate |
B |
B |
| Barium Sulfate |
B |
B |
| Barium Sulfide |
B |
B |
| Beer |
A |
A |
| Beer (Alcohol Ind.) |
A |
A |
| Beer (Beverage Ind.) |
A |
A |
| Beet Sugar Liquids |
A |
A |
| Beet Sugar Liquors |
A |
A |
| Benzaldehyde |
B |
B |
| Benzene |
B |
B |
| Benzene Hot |
B |
B |
| Benzene Sulfonic Acid |
B |
B |
| Benzoic Acid |
B |
B |
| Benzol |
A |
A |
| Benzonitrile |
D |
D |
| Benzyl Alcohol |
A |
A |
| Benzyl Benzoate |
B |
B |
| Benzyl Chloride |
C |
B |
| Bleaching Powder (Wet) |
A |
D |
| Blood |
A |
A |
| Blood (Meat Juices – Cold) |
B |
A |
| Borax (Sodium Borate) |
A |
A |
| Bordeaux Mixtures |
A |
A |
| Boric Acid |
B |
A |
| Brake Fluid (Non-Petroleum Base) |
A |
A |
| Brewery Slop |
A |
A |
| Bromine |
D |
D |
| Bromine Dry Gas |
D |
D |
| Bromine Moist Gas |
D |
D |
| Bromine-Anhydrous |
D |
D |
| Bromobenzene |
B |
B |
| Bunker Oil |
A |
A |
| Butadiene |
A |
A |
| Butane |
A |
A |
| Butanol (Butyl Alcohol) |
A |
A |
| Butter |
C |
A |
| Buttermilk |
A |
A |
| Butyl Acetate |
B |
C |
| Butyl Acetyl Ricinoleate |
A |
A |
| Butyl Amine |
A |
A |
| Butyl Benzoate |
B |
B |
| Butyl Ether |
B |
A |
| Butyl Phthalate |
B |
B |
| Butyl Stearate |
B |
B |
| Butylene |
A |
A |
| Butyric Acid |
B |
B |
| Calcium Bisulfide |
B |
B |
| Calcium Bisulfite |
B |
A |
| Calcium Carbonate (Chalk) |
B |
B |
| Calcium Chloride |
C |
C |
| Calcium Chloride Saturated |
A |
A |
| Calcium Hydroxide |
B |
B |
| Calcium Hydroxide 10% |
A |
A |
| Calcium Hydroxide 20% |
A |
A |
| Calcium Hydroxide 30% |
A |
A |
| Calcium Hypochlorite |
C |
C |
| Calcium Hypochlorite 2% Boiling |
C |
B |
| Calcium Nitrate |
C |
B |
| Calcium Nitrite |
A |
A |
| Calcium Oxide |
A |
A |
| Calcium Sulfate |
B |
B |
| Calcium Sulfide |
B |
B |
| Calgon |
A |
A |
| Cane Juice |
A |
A |
| Cane Sugar Liquors |
A |
A |
| Carbitol |
B |
B |
| Carbolic Acid (Phenol) |
B |
B |
| Carbon Bisulfide |
B |
B |
| Carbon Dioxide |
A |
A |
| Carbon Dioxide (dry) |
A |
A |
| Carbon Dioxide (wet) |
A |
A |
| Carbon Disulfide |
B |
B |
| Carbon Monoxide |
A |
A |
| Carbon Tetrachloride |
B |
B |
| Carbon Tetrachloride (dry) |
B |
B |
| Carbon Tetrachloride (wet) |
A |
A |
| Carbonated Water |
A |
A |
| Carbonic Acid |
B |
B |
| Catsup (Ketchup) |
B |
B |
| Caustic |
A |
A |
| Cellosolve |
B |
B |
| Cellosolve, Acetate |
B |
B |
| Cellosolve, Butyl |
B |
B |
| Chloric Acid |
D |
D |
| Chlorinated Water |
B |
B |
| Chlorine (dry) |
D |
B |
| Chlorine (Wet) |
D |
D |
| Chlorine Dioxide |
D |
D |
| Chlorine Trifluoride |
A |
A |
| Chlorine Water |
C |
C |
| Chlorine, Anhydrous Liquid |
D |
D |
| Chloroacetic Acid |
D |
B |
| Chloroacetone |
B |
B |
| Chlorobenzene |
B |
B |
| Chlorobromomethane |
B |
B |
| Chlorobutadiene |
B |
A |
| Chloroform |
A |
A |
| Chloronaphthalene |
B |
B |
| Chlorophenol |
B |
B |
| Chlorosulfonic Acid |
D |
D |
| Chlorosulfonic Acid Dilute |
D |
D |
| Chlorotoluene |
B |
B |
| Chlorox® (Bleach) |
A |
A |
| Chocolate Syrup |
A |
A |
| Chromic Acid – 5% |
B |
A |
| Chromic Acid – 50% |
C |
B |
| Chromic Acid 10% |
B |
B |
| Chromic Acid 30% |
B |
B |
| Chromic Acid Concentrated |
C |
C |
| Chromic Acid Dilute |
A |
A |
| Cider (Apple Juice) |
A |
A |
| Citric Acid |
B |
A |
| Citric Acid Dilute |
A |
A |
| Coca Cola Syrup |
A |
A |
| Coconut Oil (Coconut Butter) |
A |
A |
| Cod Liver Oil |
A |
A |
| Coffee |
A |
A |
| Copper Acetate |
C |
C |
| Copper Chloride |
D |
D |
| Copper Cyanide |
B |
B |
| Copper Fluoborate |
D |
D |
| Copper Fluoride |
D |
D |
| Copper Nitrate |
A |
A |
| Copper Nitrite |
A |
A |
| Copper Sulfate |
A |
A |
| Copper Sulfate – 5% Solution |
A |
A |
| Copper Sulfate >5% |
B |
B |
| Copper Sulfate 5% |
B |
B |
| Corn Oil |
B |
A |
| Cream |
D |
A |
| Creosote Hot |
B |
B |
| Cresols |
A |
A |
| Cresylic Acid |
A |
A |
| Crude Oil |
A |
A |
| Cupric Acid |
D |
B |
| Cupric Chloride |
B |
B |
| Cutting Oil (Sulfur Base) |
A |
A |
| Cutting Oil (Water Soluble) |
A |
A |
| Cyanic Acid |
A |
A |
| Cyclohexane |
B |
A |
| Cyclohexanol |
B |
B |
| Cyclohexanone |
B |
B |
| Denatured Alcohol |
A |
A |
| Detergent Solutions |
A |
A |
| Detergents General |
A |
A |
| Developing Fluids (Photo) |
A |
B |
| Diacetone |
A |
A |
| Diacetone Alcohol |
B |
B |
| Diacetone Alcohol (Acetal) |
A |
A |
| Dibenzyl Ether |
B |
B |
| Dibutyl Phthalate |
A |
A |
| Dibutyl Sebecate |
A |
A |
| Dichlorobenzene |
A |
B |
| Dichlorodifluoro Methane |
A |
B |
| Dichloroethane |
B |
B |
| Diesel Fuel |
A |
A |
| Diethanolamine |
A |
A |
| Diethyl Ether |
B |
B |
| Diethyl Sebecate |
A |
A |
| Diethylamine |
B |
B |
| Diethylene Glycol |
A |
A |
| Diisobutylene |
B |
B |
| Dimethyl Aniline |
B |
B |
| Dimethyl Formamide |
A |
B |
| Dimethyl Phthalate |
A |
B |
| Dioctyl Phthalate |
A |
A |
| Dipentene |
A |
A |
| Diphenyl |
B |
B |
| Diphenyl Ether |
A |
A |
| Diphenyl Oxide |
B |
A |
| Dowtherm Oil |
A |
A |
| Dry Cleaning Fluid |
A |
A |
| Dyes |
A |
A |
| Epichlorohydrin |
A |
A |
| Epsom Salts (Magnesium Sulfate) |
A |
B |
| Ethane |
A |
A |
| Ethanol (Ethyl Alcohol) |
A |
A |
| Ethanolamine |
A |
A |
| Ether |
A |
A |
| Ether Sulfate |
D |
D |
| Ethers |
B |
B |
| Ethyl Acetate |
B |
B |
| Ethyl Acetate 120° F |
B |
B |
| Ethyl Acetate 140° F |
B |
B |
| Ethyl Acetate 70° F |
B |
B |
| Ethyl Acrylate |
A |
A |
| Ethyl Benzene |
B |
B |
| Ethyl Benzoate |
A |
A |
| Ethyl Butyrate |
A |
A |
| Ethyl Cellulose |
B |
B |
| Ethyl Chloride |
A |
A |
| Ethyl Chloride Wet |
D |
A |
| Ethyl Ether |
B |
B |
| Ethyl Formate |
B |
B |
| Ethyl Mercaptan |
B |
B |
| Ethyl Silicate |
A |
A |
| Ethyl Sulfate |
D |
D |
| Ethylene (Ethene) |
A |
A |
| Ethylene Bromide |
A |
B |
| Ethylene Chloride |
B |
B |
| Ethylene Chlorohydrin |
B |
B |
| Ethylene Diamine |
B |
B |
| Ethylene Dibromide |
B |
B |
| Ethylene Dichloride |
B |
B |
| Ethylene Glycol |
B |
B |
| Ethylene Oxide |
C |
C |
| Ethylene Trichloride |
A |
A |
| Fatty Acids |
B |
A |
| Ferric Chloride |
D |
D |
| Ferric Chloride Concentrated |
D |
D |
| Ferric Nitrate |
B |
B |
| Ferric Sulfate |
B |
A |
| Ferrous Chloride |
D |
D |
| Ferrous Sulfate |
B |
B |
| Fluoboric Acid |
B |
B |
| Fluorine |
C |
A |
| Fluorine (Liquid) |
A |
A |
| Fluorine Gas Dry – 300° F |
A |
B |
| Fluorine Gas Wet |
D |
D |
| Fluosilicic Acid |
C |
B |
| Formaldehyde |
D |
A |
| Formaldehyde 40% |
A |
A |
| Formic Acid |
C |
C |
| Freon – Wet |
C |
D |
| Freon 11 |
A |
A |
| Freon 112 |
A |
A |
| Freon 113 |
A |
A |
| Freon 114 |
A |
A |
| Freon 114B2 |
A |
A |
| Freon 115 |
A |
A |
| Freon 12 |
B |
B |
| Freon 13 |
A |
A |
| Freon 13B1 |
A |
A |
| Freon 14 |
A |
A |
| Freon 21 |
A |
A |
| Freon 22 |
A |
A |
| Freon 31 |
A |
A |
| Freon 32 |
A |
A |
| Freon 502 |
A |
A |
| Freon Bf |
A |
A |
| Freon C318 |
A |
A |
| Freon Dry |
A |
A |
| Freon Dry F11 |
A |
A |
| Freon Dry F12, F113, F114 |
A |
A |
| Freon Dry F21, F22 |
A |
A |
| Freon K-142B |
A |
A |
| Freon K-152K |
A |
A |
| Freon Mf |
A |
A |
| Freon Pca |
A |
A |
| Freon TF |
A |
A |
| Freonr 11 |
A |
A |
| Fruit Juice |
A |
A |
| Fuel Oils (ASTM #1 thru #9) |
A |
A |
| Furan (Furfuran) |
A |
A |
| Furan Resin |
A |
A |
| Furfural (Ant Oil) |
B |
B |
| Gallic Acid |
B |
B |
| Gas Natural |
A |
A |
| Gasoline (Aviation) |
A |
A |
| Gasoline (high-aromatic) |
A |
A |
| Gasoline (Leaded) |
A |
A |
| Gasoline (Meter) |
A |
A |
| Gasoline (Unleaded) |
A |
A |
| Gasoline Leaded Refined |
A |
A |
| Gasoline Sour |
A |
A |
| Gasoline Unleaded Refined |
A |
A |
| Gelatin |
A |
A |
| Glucose (Corn Syrup) |
A |
A |
| Glue (PVA) |
B |
A |
| Glycerin (Glycerol) |
A |
A |
| Glycol |
B |
B |
| Glycolic Acid |
A |
A |
| Glycols |
B |
B |
| Gold Monocyanide |
D |
A |
| Grape Juice |
A |
A |
| Grapefruit Oil |
A |
A |
| Grease |
A |
A |
| Grease (Ester Base) |
A |
A |
| Grease (Petroleum Base) |
A |
A |
| Grease (Silicone Base) |
A |
A |
| Helium |
A |
A |
| Heptane |
A |
A |
| Hexamine |
A |
A |
| Hexane |
A |
A |
| Hexanol Tertiary |
A |
A |
| Honey |
A |
A |
| Hydraulic Oil (Petro) |
A |
A |
| Hydraulic Oil (Petroleum Base) |
A |
A |
| Hydraulic Oil (Petroleum) |
A |
A |
| Hydraulic Oil (Synthetic) |
A |
A |
| Hydrazine |
A |
A |
| Hydrobromic Acid |
D |
D |
| Hydrobromic Acid 20% |
D |
D |
| Hydrochloric Acid – 10% |
D |
D |
| Hydrochloric Acid – 20% |
D |
D |
| Hydrochloric Acid – 37% |
D |
D |
| Hydrochloric Acid 100% |
D |
D |
| Hydrochloric Acid, Dry Gas |
D |
D |
| Hydrocyanic Acid |
B |
A |
| Hydrofluoric Acid |
D |
D |
| Hydrofluoric Acid (Conc.) (Cold) |
D |
D |
| Hydrofluoric Acid (Hot) |
D |
B |
| Hydrofluoric Acid 100% |
D |
B |
| Hydrofluoric Acid 20% |
D |
D |
| Hydrofluoric Acid 50% |
D |
D |
| Hydrofluoric Acid 75% |
D |
D |
| Hydrofluosilicic Acid 100% |
D |
D |
| Hydrofluosilicic Acid 20% |
C |
D |
| Hydrogen Chloride Gas Dry |
A |
A |
| Hydrogen Chloride Gas Wet |
D |
B |
| Hydrogen Cyanide |
B |
A |
| Hydrogen Fluoride Anhydrous |
B |
A |
| Hydrogen Gas |
A |
A |
| Hydrogen Peroxide – 10% |
B |
B |
| Hydrogen Peroxide – 100% |
B |
A |
| Hydrogen Peroxide – 30% |
B |
B |
| Hydrogen Peroxide – 50% |
B |
A |
| Hydrogen Sulfide (dry) |
C |
A |
| Hydrogen Sulfide (wet) |
C |
A |
| Hydrogen Sulfide Dry |
C |
A |
| Hydroquinone |
B |
B |
| Hypochlorous Acid |
D |
D |
| Ink (Printers) |
C |
C |
| Iodine |
D |
D |
| Iodoform |
B |
B |
| Isobutyl Alcohol |
A |
A |
| Isooctane |
A |
A |
| Isophorone |
A |
A |
| Isopropyl Acetate |
C |
B |
| Isopropyl Alcohol |
A |
A |
| Isopropyl Chloride |
A |
A |
| Isopropyl Ether |
A |
A |
| Jet Fuel (JP1 to JP6) |
A |
A |
| Jp-1 |
A |
A |
| Jp-2 |
A |
A |
| Jp-3 |
A |
A |
| Jp-4 |
A |
A |
| Jp-5 |
A |
A |
| Jp-6 |
A |
A |
| Jp-X |
A |
A |
| Kerosene |
A |
A |
| Ketchup |
A |
A |
| Ketones |
A |
A |
| Lacquer Solvents |
A |
A |
| Lacquer Thinners |
A |
A |
| Lacquers |
A |
A |
| Lactic Acid |
B |
B |
| Lard |
B |
A |
| Lard Oil (Cold) |
A |
A |
| Lard Oil (Hot) |
A |
A |
| Latex |
A |
A |
| Lauryl Alcohol (N-Dodecanol) |
A |
A |
| Lead Acetate |
B |
B |
| Lead Molten |
B |
B |
| Lead Nitrate |
B |
B |
| Lead Sulfamate |
C |
C |
| Lemon Oil |
A |
A |
| Ligroin |
A |
A |
| Lime |
A |
A |
| Lime Bleach |
A |
A |
| Lime Sulfur |
A |
A |
| Lineoleic Acid |
B |
A |
| Linoleic Acid |
B |
A |
| Lithium Chloride |
A |
A |
| Lithium Hydroxide |
B |
B |
| Lubricants |
A |
A |
| Lubricants (Petroleum) |
A |
A |
| Lubricating Oil |
A |
A |
| Lubricating Oil Di-Ester |
A |
A |
| Lye (Calcium Hydroxide) |
B |
B |
| Lye (Potassium Hydroxide) |
B |
A |
| Lye (Sodium Hydroxide) |
B |
B |
| Lye 10% |
B |
A |
| Lye 50% |
B |
B |
| Lye Concentrated |
B |
D |
| Lye Solutions |
A |
A |
| Magnesium Bisulfate |
A |
B |
| Magnesium Carbonate |
B |
B |
| Magnesium Chloride |
D |
D |
| Magnesium Hydroxide (Milk of Magnesia) |
B |
A |
| Magnesium Nitrate |
B |
B |
| Magnesium Oxide |
A |
A |
| Magnesium Sulfate |
A |
B |
| Maleic Acid |
B |
B |
| Maleic Anhydride |
A |
A |
| Malic Acid |
A |
A |
| Malt Beverages |
A |
A |
| Manganese Sulfate |
B |
B |
| Mash |
A |
A |
| Mayonnaise |
C |
A |
| Mercuric Chloride |
D |
D |
| Mercuric Chloride (Dilute Solution) |
D |
D |
| Mercuric Cyanide |
C |
C |
| Mercurous Nitrate |
B |
B |
| Mercury |
A |
A |
| Mesityl Oxide |
A |
A |
| Methane |
A |
A |
| Methanol |
A |
A |
| Methyl Acetate |
A |
B |
| Methyl Acetone |
A |
A |
| Methyl Alcohol |
B |
A |
| Methyl Alcohol 10% |
A |
A |
| Methyl Amine |
A |
A |
| Methyl Bromide |
A |
A |
| Methyl Butyl Ketone |
A |
A |
| Methyl Cellosolve |
B |
B |
| Methyl Chloride |
A |
A |
| Methyl Chloride (Dry) |
A |
A |
| Methyl Chloride (Wet) |
A |
A |
| Methyl Ethyl Ketone (MEK) |
A |
A |
| Methyl Formate |
B |
B |
| Methyl Isobutyl Ketone (MIBK) |
B |
B |
| Methyl Isopropyl Ketone |
A |
A |
| Methyl Methacrylate |
B |
B |
| Methylamine |
A |
A |
| Methylene Chloride |
B |
B |
| Milk |
A |
A |
| Mineral Oil |
A |
A |
| Mineral Spirits |
A |
A |
| Mixed Acids |
D |
D |
| Molasses |
A |
A |
| Monochloroacetic acid |
D |
B |
| Monochlorobenzene |
B |
B |
| Monochlorodifluoro Methane |
A |
A |
| Monoethanolamine |
A |
B |
| Motor oil |
A |
A |
| Muriatic Acid |
D |
D |
| Mustard |
D |
D |
| Naphtha |
A |
A |
| Naphthalene |
A |
B |
| Napthenic Acid |
A |
A |
| Natural Gas |
A |
A |
| Neatsfoot Oil |
A |
A |
| N-Hexaldehyde |
A |
A |
| Nickel Chloride |
D |
C |
| Nickel Nitrate |
B |
B |
| Nickel Sulfate |
B |
B |
| Nitrating Acid (<15% HNO3) |
C |
D |
| Nitrating Acid (>15% H2SO4) |
C |
C |
| Nitrating Acid (S1% Acid) |
C |
A |
| Nitrating Acid (S15% H2SO4) |
C |
C |
| Nitric Acid – 10% |
A |
A |
| Nitric Acid – 20% |
A |
A |
| Nitric Acid – 25% |
A |
A |
| Nitric Acid – 35% |
A |
A |
| Nitric Acid – 50% |
B |
A |
| Nitric Acid – 70% |
A |
A |
| Nitric Acid (5-10% Solution) |
A |
A |
| Nitric Acid (Conc.) |
A |
A |
| Nitric Acid (Red Fuming) |
B |
B |
| Nitric Acid Dilute |
A |
A |
| Nitrobenzene |
B |
B |
| Nitrogen |
A |
A |
| Nitromethane |
A |
A |
| Nitrous Acid |
B |
B |
| Nitrous Oxide |
D |
B |
| O-Dichlorobenzene |
B |
B |
| Oils: Aniline |
A |
A |
| Oils: Castor |
A |
A |
| Oils: Cinnamon |
A |
A |
| Oils: Citric |
A |
A |
| Oils: Clove |
A |
A |
| Oils: Coconut |
A |
A |
| Oils: Cod Liver |
A |
A |
| Oils: Corn |
B |
A |
| Oils: Cottonseed |
C |
A |
| Oils: Creosote |
B |
B |
| Oils: Crude |
A |
A |
| Oils: Diesel Fuel (20,30,40,50) |
A |
A |
| Oils: Fuel (1,2,3,5A,5B,6) |
A |
A |
| Oils: Ginger |
D |
D |
| Oils: Hydraulic Oil (Petro) |
A |
A |
| Oils: Hydraulic Oil (Synthetic) |
A |
A |
| Oils: Lemon |
A |
A |
| Oils: Linseed |
A |
A |
| Oils: Mineral |
A |
A |
| Oils: Neatsfoot |
A |
A |
| Oils: Olive |
B |
A |
| Oils: Orange |
A |
A |
| Oils: Palm |
A |
A |
| Oils: Peanut |
A |
A |
| Oils: Peppermint |
A |
A |
| Oils: Pine |
A |
A |
| Oils: Rapeseed |
A |
A |
| Oils: Rosin |
A |
A |
| Oils: Sesame Seed |
A |
A |
| Oils: Silicone |
A |
A |
| Oils: Soybean |
A |
A |
| Oils: Sperm (whale) |
A |
A |
| Oils: Tanning |
A |
A |
| Oils: Transformer |
A |
A |
| Oils: Tung (Wood Oil) |
A |
B |
| Oils: Turbine |
A |
A |
| Oils: Vegetable |
A |
A |
| Oleic Acid |
A |
A |
| Oleum 100% (Fuming Sulfuric) |
A |
A |
| Oleum 25% |
B |
B |
| Oleum Spirits |
B |
B |
| Olive Oil |
B |
A |
| Oxalic Acid (cold) |
D |
D |
| Oxygen |
A |
A |
| Ozone |
B |
B |
| Paint Thinner, Duco |
B |
A |
| Paints & Solvents |
A |
A |
| Palm Oil |
A |
A |
| Palmitic Acid |
B |
A |
| Paraffin |
A |
A |
| Peanut Oil |
A |
A |
| Pentane |
C |
C |
| Peppermint Oil |
A |
A |
| Perchloric Acid |
D |
D |
| Perchloroethylene |
B |
A |
| Petrolatum |
A |
A |
| Petroleum |
A |
A |
| Petroleum Ether |
A |
A |
| Phenol (10%) |
B |
B |
| Phenol (Carbolic Acid) |
B |
B |
| Phenol Sulfonic Acid |
B |
B |
| Phosphoric Acid – 20% |
A |
B |
| Phosphoric Acid (>40%) |
D |
D |
| Phosphoric Acid (crude) |
D |
B |
| Phosphoric Acid (S40%) |
D |
C |
| Phosphoric Acid Aerated |
A |
B |
| Phosphoric Acid Air Free |
D |
A |
| Phosphoric Acid Boiling |
D |
D |
| Phosphorous Trichloride Acid |
A |
A |
| Phosphorus |
A |
A |
| Phosphorus Trichloride |
A |
A |
| Photographic Developer |
A |
A |
| Photographic Solutions |
D |
A |
| Phthalic Acid |
B |
B |
| Phthalic Anhydride |
A |
A |
| Picric Acid |
D |
D |
| Pine Oil |
A |
A |
| Plating Solutions – Antimony |
A |
A |
| Plating Solutions – Arsenic |
A |
A |
| Plating Solutions – Brass |
A |
A |
| Plating Solutions – Bronze |
A |
A |
| Plating Solutions – Bronze (Cu-Sn Bronze Bath 160°F) |
A |
A |
| Plating Solutions – Bronze (Cu-Zn Bronze Bath 100°F) |
A |
A |
| Plating Solutions – Cadmium (Fluoborate Bath 100°F) |
A |
A |
| Plating Solutions – Chrome |
A |
A |
| Plating Solutions – Copper (Copper Fluoborate Bath 120°F) |
A |
D |
| Plating Solutions – Gold |
A |
D |
| Plating Solutions – Indium |
A |
C |
| Plating Solutions – Iron |
A |
A |
| Plating Solutions – Lead |
A |
C |
| Plating Solutions – Nickel |
A |
A |
| Plating Solutions – Silver |
A |
A |
| Plating Solutions – Tin |
B |
A |
| Plating Solutions – Zinc |
A |
A |
| Potash (Potassium Carbonate) |
B |
B |
| Potassium Acetate |
B |
B |
| Potassium Aluminum Sulfate |
D |
B |
| Potassium Bicarbonate |
B |
B |
| Potassium Bichromate |
B |
B |
| Potassium Bromide |
D |
B |
| Potassium Carbonate (Potash) |
B |
B |
| Potassium Chlorate |
B |
B |
| Potassium Chloride |
C |
C |
| Potassium Chromate |
B |
B |
| Potassium Cyanide |
B |
B |
| Potassium Dichromate |
B |
B |
| Potassium Ferricyanide |
B |
B |
| Potassium Ferrocyanide |
B |
B |
| Potassium Hydrate |
A |
B |
| Potassium Hydroxide |
B |
A |
| Potassium Hypochlorite |
D |
B |
| Potassium Iodide |
B |
A |
| Potassium Nitrate |
B |
B |
| Potassium Oxolate |
B |
B |
| Potassium Permanganate |
B |
B |
| Potassium Sulfate |
B |
B |
| Potassium Sulfide |
B |
B |
| Potassium Sulfite |
B |
A |
| Propane |
A |
A |
| Propane (Liquified) |
A |
A |
| Propyl Acetate |
A |
A |
| Propyl Alcohol |
A |
A |
| Propylene |
B |
A |
| Propylene Glycol |
B |
B |
| Propylene Oxide |
A |
A |
| Pydraul |
A |
A |
| Pyridine |
B |
B |
| Pyrogallic Acid |
D |
B |
| Pyroligneous Acid (Wood Vinegar) |
B |
B |
| Quinine Bisulfate |
B |
B |
| Quinine Sulfate |
B |
B |
| Rapeseed Oil |
A |
A |
| Rosin |
B |
B |
| Rosin Oil |
A |
A |
| Rum |
A |
A |
| Rust Inhibitors |
A |
A |
| Sal Ammoniac |
B |
A |
| Salad Dressings |
A |
A |
| Salicylic Acid |
B |
B |
| Salt Brine |
B |
D |
| Salt Water |
C |
B |
| Sea Water |
C |
C |
| Sesame Seed Oil |
A |
A |
| Sewage |
A |
A |
| Shellac |
A |
A |
| Shellac (Bleached) |
A |
A |
| Shellac (Orange) |
A |
A |
| Silicone |
A |
A |
| Silicone Oil |
A |
A |
| Silver Bromide |
D |
D |
| Silver Chloride |
D |
D |
| Silver Cyanide |
A |
A |
| Silver Nitrate |
B |
B |
| Soap Solutions |
A |
A |
| Soda Ash |
A |
A |
| Sodium Acetate |
B |
B |
| Sodium Acid Sulfate |
D |
B |
| Sodium Aluminate |
A |
A |
| Sodium Aluminum Sulfate |
D |
A |
| Sodium Bicarbonate |
A |
B |
| Sodium Bichromate |
B |
B |
| Sodium Bisulfate |
D |
C |
| Sodium Bisulfite |
C |
B |
| Sodium Borate |
C |
B |
| Sodium Borate (Borax) |
B |
B |
| Sodium Bromide |
C |
C |
| Sodium Carbonate |
A |
A |
| Sodium Chlorate |
B |
B |
| Sodium Chloride |
C |
C |
| Sodium Chromate |
B |
B |
| Sodium Cyanide |
A |
B |
| Sodium Ferrocyanide |
B |
B |
| Sodium Fluoride |
D |
D |
| Sodium Hydroxide (20%) |
B |
B |
| Sodium Hydroxide (50%) |
B |
B |
| Sodium Hydroxide (80%) |
D |
D |
| Sodium Hydroxide (Caustic Soda-Lye) |
A |
A |
| Sodium Hypochlorite |
D |
A |
| Sodium Hypochlorite (<20%) |
C |
C |
| Sodium Hypochlorite (100%) |
D |
D |
| Sodium Hyposulfate |
A |
A |
| Sodium Hyposulfite |
D |
D |
| Sodium Metaphosphate |
D |
D |
| Sodium Metasilicate |
A |
A |
| Sodium Nitrate |
B |
B |
| Sodium Nitrate Moten |
B |
A |
| Sodium Perborate |
B |
C |
| Sodium Peroxide |
B |
A |
| Sodium Phosphate |
B |
B |
| Sodium Polyphosphate |
B |
B |
| Sodium Silicate (Water Glass) |
A |
B |
| Sodium Sulfate (Salt Cake) |
B |
B |
| Sodium Sulfide |
B |
D |
| Sodium Sulfite |
D |
B |
| Sodium Tetraborate |
A |
A |
| Sodium Thiosulfate |
B |
B |
| Sorghum |
A |
A |
| Soy Sauce |
D |
D |
| Soybean Oil |
A |
A |
| Stannic Chloride |
D |
D |
| Stannous Chloride |
C |
A |
| Starch |
B |
B |
| Stearic Acid |
B |
B |
| Stoddard Solvent |
A |
A |
| Styrene |
A |
A |
| Sugar (Liquids) |
A |
A |
| Sulfate (Liquors) |
B |
B |
| Sulfate Liquor Black |
B |
B |
| Sulfite Liquor |
B |
B |
| Sulfolane |
D |
B |
| Sulfur |
D |
D |
| Sulfur Chloride |
D |
D |
| Sulfur Dioxide |
D |
A |
| Sulfur Dioxide (dry) |
D |
A |
| Sulfur Dioxide Gas Dry |
A |
A |
| Sulfur Trioxide |
B |
C |
| Sulfur Trioxide (dry) |
D |
C |
| Sulfuric Acid (<10%) |
D |
C |
| Sulfuric Acid (10-75%) |
D |
D |
| Sulfuric Acid (75-100%) |
C |
D |
| Sulfuric Acid (cold concentrated) |
C |
B |
| Sulfuric Acid (hot concentrated) |
D |
C |
| Sulfuric Acid Fuming Oleum |
B |
B |
| Sulfurous Acid |
D |
B |
| Syrup |
A |
A |
| Tall Oil |
D |
B |
| Tallow |
A |
A |
| Tannic Acid |
B |
A |
| Tanning Liquors |
A |
A |
| Tar And Tar Oil |
B |
A |
| Tar, Bituminous |
A |
B |
| Tartaric Acid |
C |
C |
| Terpineol |
A |
A |
| Tertiary Butyl Catechol |
B |
B |
| Tetra Ethyl Lead |
A |
A |
| Tetrachloroacetic Acid |
D |
D |
| Tetrachloroethane |
C |
A |
| Tetrachloroethylene |
A |
B |
| Tetrahydrofuran |
A |
A |
| Tetralin |
A |
A |
| Tetraphosphoric Acid |
B |
B |
| Thionyl Chloride |
D |
D |
| Tin Molten |
C |
C |
| Tin Tetrachloride |
D |
D |
| Titanium Tetrachloride |
B |
B |
| Toluene (Toluol) |
A |
A |
| Toluene At 70° |
A |
A |
| Tomato Juice |
A |
A |
| Tomato Pulp & Juice |
A |
A |
| Transformer Oil |
A |
A |
| Transmission Fluid (Type A) |
A |
A |
| Tributyl Phosphate |
A |
A |
| Trichloroacetic Acid |
D |
D |
| Trichloroethane |
B |
B |
| Trichloroethylene |
B |
B |
| Trichloromonofluoroethane (Freon 17) |
A |
A |
| Trichloropropane |
A |
A |
| Trichlorotrifluoroethane (Freon 113) |
A |
A |
| Tricresyl Phosphate |
B |
B |
| Tricresylphosphate |
B |
B |
| Triethanol Amine |
A |
A |
| Triethanolamine |
A |
A |
| Triethyl Phosphate |
A |
A |
| Triethylamine |
A |
A |
| Triphenyl Phosphite |
A |
A |
| Trisodium Phosphate |
B |
B |
| Tung Oil |
A |
B |
| Turbine Oil |
A |
A |
| Turpentine |
A |
A |
| Urea |
B |
B |
| Uric Acid |
B |
B |
| Urine |
A |
A |
| Vanilla Extract |
A |
A |
| Varnish |
A |
A |
| Vegetable Juice |
A |
A |
| Vegetable Oil |
A |
A |
| Vegetable Oil (Hot) |
B |
B |
| Vinegar |
B |
A |
| Vinyl Acetate |
B |
B |
| Vinyl Chloride |
B |
A |
| Water |
A |
A |
| Water, Acid Mine |
B |
B |
| Water, Boiler Feed |
A |
A |
| Water, Brackish |
A |
A |
| Water, Deionized |
A |
A |
| Water, Demineralized |
A |
A |
| Water, Distilled |
A |
A |
| Water, Fresh |
A |
A |
| Water, Salt |
C |
C |
| Water-Brine, Process, Beverage |
B |
B |
| Waxes |
D |
A |
| Weed Killers |
A |
A |
| Whey |
A |
A |
| Whiskey |
A |
A |
| Whiskey & Wines |
A |
A |
| White Liquor (Pulp Mill) |
B |
A |
| White Water (Paper Mill) |
A |
A |
| Wine |
A |
A |
| Wood Pulp |
A |
A |
| Xylene |
B |
B |
| Zinc Carbonate |
B |
B |
| Zinc Chloride |
D |
D |
| Zinc Cyanide |
A |
A |
| Zinc Hydrosulfite |
A |
A |
| Zinc Molten |
D |
D |
| Zinc Nitrate |
A |
A |
| Zinc Sulfate |
B |
A |
 The Augustana Campus chemistry labs have traditionally been perfectly acceptable, but have yielded somewhat standard chemistry experiments with very typical analysis. As a satellite campus of the University of Alberta, located in Camrose, Alberta, we have strived to be almost an extension of our North Campus sibling, which has proved problematic within the constraints of a 100 kilometers distance. Recently, things have changed. Last summer, we diverged from this straightforward and customary path and decided to do something slightly different. Along with our newly renovated labs—that encourage thought and collaboration—we have fundamentally changed our first-year chemistry lab experiments, which mean that different analyzation techniques are needed. Gone are vitamin C titrations with Tang and tablets, replaced by extraction techniques and spectral analysis. Hand-held spectroscopes have been replaced with a fiber optic cable in a light emissions lab while also adding a light measurement for chemiluminescence.
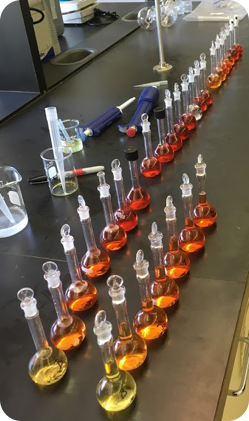 Our previous vitamin C laboratory experiment was based in a traditional vein, where titrations were used to determine the vitamin C content in both Tang (a powdered orange drink very few students today have ever experienced) and 500mg vitamin C tablets. Being a “traditional” lab exercise meant that most students likely had seen this done in high school or had done this very titration themselves. Our goal was to create an experience where the students learn a new analytical technique by extracting vitamin C from a pepper, then determining the vitamin C concentration from a standard calibration curve on a PASCO Wireless Spectrometer. All of these skills are taught in the first week of this exercise. Week two is all about the inquisitive nature and enthusiasm of the first-year chemistry students. We wanted them to start critically thinking about what they read and whether or not it is scientifically sound, and we also wanted students to gain confidence in their research abilities right away, both in a laboratory setting and with data analysis. The idea is that students would formulate a research question and then create a hypothesis to test in the lab to add to their skills. Since the PASCO Wireless Spectrometers allow us to keep data sets, we could use the same calibration curves throughout the testing.
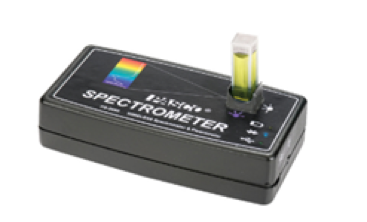
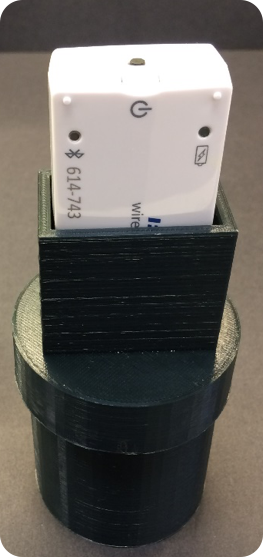
 Light emissions lab experiments can be tedious at best. You need to constantly be looking through a hand-held spectroscope, which is exactly what we were asking our students to do. Also, we were looking at lights, flame tests and emission tubes with said spectroscopes. Throughout all of this, we weren’t asking the students to really do anything else, chemically speaking. Chemiluminescence and chromatography columns were two things we decided to add into our updated labs, along with the fiber optic cable accessory for the Wireless Spectrometers (as well as scaling back the spectroscope use). In the first part of our experiment, students would activate a glow stick and add the content to our 3D printed Light Calorimeter, then read the light emitted using the PASCO Wireless Light Sensor. From here, students would take the glow stick content and run it through a silica gel column to remove the chemical that activates the “glow”, then read the light emitted again. Peroxide and sodium salicylate would then be added to get the “glow” to return, and one last reading on SPARKvue would be taken.
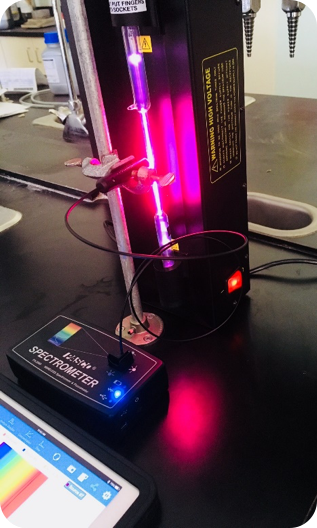
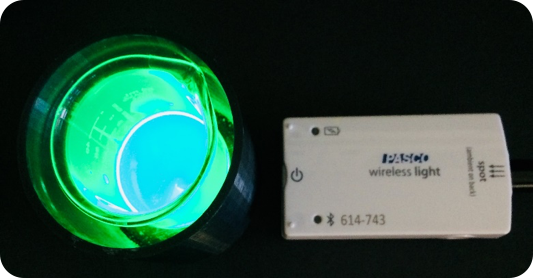 By using this method, we wanted students to learn not only about columns and their ability to separate mixtures but also to get comfortable learning how to collect data using a sensor and a data logger (in this case an iPad). In the second part of our experiment, we still use traditional light emission tubes (Argon, Helium, etc.) where we use spectroscopes to obtain the emission spectrum lines. For the hydrogen tube, however, we set up the fiber optic cable accessory and the PASCO Wireless Spectrometer to get the most precise emission light spectrum we can. Ideally, the students learn both techniques but come away with the appreciation for the newer tech.
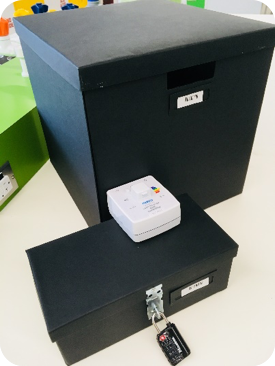 Since the wireless sensors are easily incorporated into our lab designs, we have set our sights on adding the brand new PASCO Wireless Colorimeter to our forensic based Escape Box Lab to give students an idea how an analysis of this type could be performed in the field.
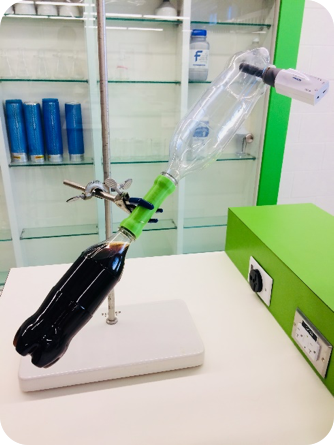 We also have a unique laboratory based three-week course for non-science majors that utilizes the PASCO Wireless CO2 sensor in an interesting way. Our laboratory future is both bright and innovative, and more importantly, possible, with the tools from PASCO at our disposal.


 Chemvue is an intuitively designed software for chemistry investigations, programmed with input from faculty for college lab student success. It enables convenient data collection and analysis, elegant college lab report design, and easy export options. Coming soon to your local device.