I’ve been teaching physics for years and for most of the years that meant one thing: ticker tape. Don’t get me wrong, there is a certain elegance to labs using ticker tape; there just isn’t as much depth. Enter the PASCO Smart Cart and SparkVue software.
I’ve had the carts for a few years now and I keep learning more things to do with them. I wanted students to go deeper into Newton’s laws but how could I do that with the Smart Carts and SparkVue? Here’s what I came up with.
I took my old set-up from the ticker tape days. Have a cart pulled across a table pulled by a hanging mass over a pulley. Change the amount of mass on the cart and the amount pulling the cart. Calculate the acceleration using kinematics. Compare the mass times the acceleration to the weight hanging over the edge.
That set-up is lowish friction, which we could hand-wave away, but I never liked doing that. If we used the carts on a track with the Super pulley would I get better results? Indeed, I did. Measured accelerations were within 10% of theoretical. Could I do better?
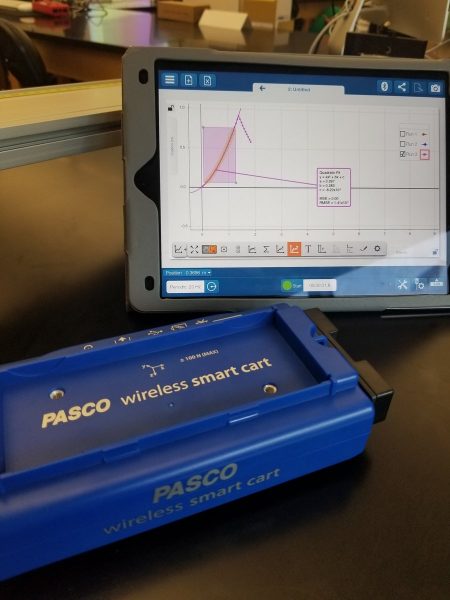
I attached the hook to the carts and used the force sensor to measure the tension pulling the cart. Using the data from the force sensor I got within 1% of expected values! This is great accuracy and a starting point for going deeper. Why does the force sensor start with the force of the hanging mass and then drop? Why does the force sensor data give better data then using the values of the hanging mass?
The old lab changed the mass on the cart and the mass hanging off the edge to compare the effects of changing the mass of the system or changing the force of the system. Good but not great. Now I can do the lab over the pulley or run the string through the end stop for increased friction. The students can compare different variations of the set up in the same amount of time it took with the ticker-tape.
With ticker-tape it took a long time and didn’t go very deep; basic understanding only. Now with the Smart Carts and SparkVue we can go deeper, quicker. Isn’t that what we are after? Critical thinking and deeper learning? PASCO’s products offer a chance for that and I am grateful for it.
We high school physics teachers tend to associate the right-hand rules with electromagnetism. As a student, my first encounter with a right-hand rule was when I was introduced to the magnetic field produced by the electric current in a long, straight wire: if you point the thumb of your right hand in the direction of the conventional current and imagine grasping the wire with your hand, your fingers wrap around the wire in a way that is analogous to the magnetic field that circulates around the wire.
I only later discovered that this same rule can be applied to rotational quantities such as angular velocity and angular momentum. The topic of rotation has become more important in AP physics when the program was updated from the older Physics B program. Strictly speaking, AP Physics 1 does not include the use of the right hand rule for rotation, but I have found that introducing it actually helps solidify student understanding of angular vectors.
Describing the direction of rotation as being clockwise or counterclockwise is helpful only if all parties involved have a common point of view, which is ideally along the axis of rotation. As with left and right, clockwise and counterclockwise depend on your point of view. This is why it is often preferable to describe translational motion in terms of north, south, east, west, up, and down, or with respect to a defined x-y-z coordinate system; directions can be communicated unambiguously, provided that everybody uses the same coordinate system.
It is precisely for this reason that the right hand rule can (and should) be used for rotational motion. Consider the hands of an analog clock. Assuming that the clock is a typical one, it will have hands that turn “clockwise” when viewed from the “usual” point of view, but if the clock had a transparent back and you were to view it from the back you would see the hands turning “counterclockwise!” The observed direction of rotation (clockwise or counterclockwise) depends on the observer’s point of view.
Instead of using clockwise and counterclockwise, we can describe the direction of rotation with a right hand rule: if you curl the fingers of your right hand around with the direction of the rotational motion, your thumb will point in the direction of rotation, which will be along the axis of rotation. Applying this to the above we find that when viewing a clock from the front, the rotation of the hands is three dimensionally into the clock (away from the observer), and when viewing a clock from the back side, the rotation of the hands is three dimensionally out of the clock (toward the observer). If two people view a transparent clock at the same time but one observes it from the front while the other observes it from the back (i.e. the clock is between the two people who are facing each other), they will disagree on which way the hands turn (clockwise or counterclockwise) but will agree on this direction if both use the right hand rule convention to describe the direction of the rotational motion – both observers will agree that it is directed toward the person viewing the back side of the clock.
When first learning about the right hand rule, students are often initially confused, with many students failing to grasp why such a rule is even useful in the first place. Before introducing the right hand rule I like to begin by holding an object such as a meter stick while standing at the front of the classroom. I then rotate the meter stick through its center so that the students claim that it is rotating “clockwise” when asked. Being careful to keep the rotational motion as constant as possible, I then walk to the back of the room. It’s important that the students see that at no point did I stop the rotation of the meter stick – it is still turning the same way as before, and yet at some point each student finds that they must turn around in order to continue to see it. Many students are astonished to see that the meter stick is now rotating counter clockwise from their (now reversed) point of view. This helps establish the need for a better way to describe rotation.
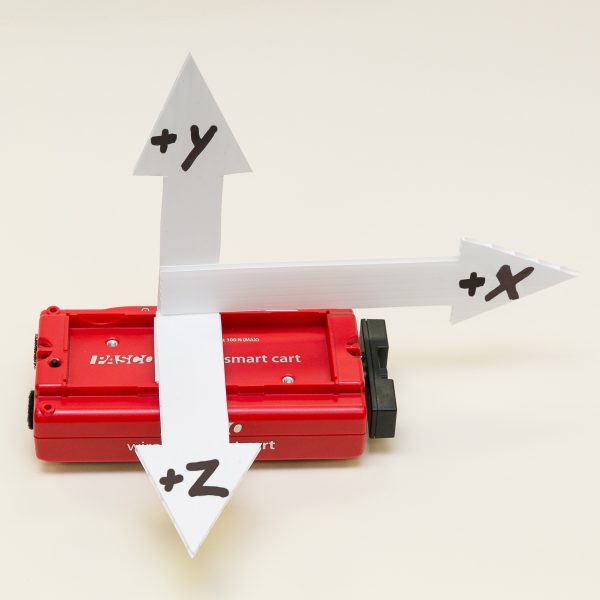
I then introduce the right hand rule and go through a couple of examples. Traditionally, this would have been the end of it, but last year I was able to take advantage of my newly acquired PASCO Smart Cart, which has a wireless 3-axis gyroscope (i.e. rotational sensor). The coordinate system is fixed with respect to the cart, and is printed on the cart itself, but I like to make this more visible by attaching cardboard cutout vectors onto the cart which make the axes more visible to the students while I hold the cart up for them to see. I then set up a projected display of the angular velocity of the cart along each axis simultaneously. I then ask the students how I must turn the cart in order to get a desired rotation of my choosing (i.e. ±x, ±y, and ±z).
I really like how the carts, along with the live display of the 3 angular velocity components make the admittedly abstract right hand rule so much more concrete. Seeing the display agree with our predictions makes it so much more real and is much, much better than me merely saying “trust me.” I have found that introducing and using this right hand rule with rotation has made using this same rule much more natural when using it to later relate the direction of current flow and the magnetic field.
It was the shot heard across Canada. There were a lot of factors that made Kawhi’s buzzer beating basket so remarkable. Aside from there being no time left on the clock and the weight of a sport’s nation on his shoulders, Kawhi had to overcome the backward momentum that is inherent in a ‘fadeaway’. The purpose of a fadeway is to create space between the shooter and defender(s), which was a necessity for Kawhi as there were several seriously tall 76ers trying to screen his shot.
Over-coming the fadeway’s backwards momentum is no easy feat as it requires players to quickly calibrate in their minds the additional force that is required to successfully sink a basket, which for most mere mortals is not intuitive. The shot is so challenging that only a handful of NBA basketball players have been able to reliably make this shot; and we’re talking the great players such as Michael Jordan, Lebron James, Kobe Bryant and of course Kawhi Leonard.
The video below provides an extreme example of backwards momentum with a soccer ball shot from the back of a truck
Investigating Kawhi Leonard’s shot in the lab
In addition to backwards momentum there were many additional physical factors at play such as the angle of the shot and gravity. Investigating all these forces in a single activity would not be practical. Fortunately most of these forces can be isolated and explored in the lab using PASCO sensors, software and/or equipment.
Exploring The fadeaway’s negative momentum using PASCO
PASCO offers an intriguing and affordable solution to model the dramatic effect of a fadeaway’s negative momentum on projectile distance. PASCO’s mini launcher will consistently launch projectile balls the same horizontal distance for a set angle, assuming that the launcher is stationary. If however, the launcher is placed on PASCO’s frictionless cart, the force of pulling the trigger will cause the cart to move backwards at a velocity that can be measured using the motion sensor. Students will be surprised to see that even though the cart travels just a few centimeters, the overall projectile distance is significantly reduced. This can be a very simple demonstration or an in-depth quantitative analysis that factors in the projectiles initial angle and velocity, the time of flight and even the k-constant of the spring.
Other Forces Affecting a Basketball Shot
Momentum and Explosions
When a basketball player takes a jump shot (as with a fadeway), the player and the ball could be viewed as 2-object linear system if you ignore other outside forces such as gravity. What’s interesting, and perhaps not apparent to many students, is that the basketball will exert an equivalent force to the player as the player is exerting on the basketball (Newton’s 3rd Law). Of course because of the very significant inertia (mass) difference between the two objects, the basketball will accelerate at a much fast rate than the player. The player however will experience some acceleration in the opposite direction to that of the basketball.
Using Smart Carts to explore Momentum and Explosions (Free Lab)
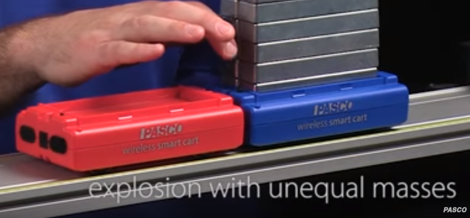
The Wireless Smart Carts are equipped with an exploding plunger. Multiple 250g bars can be added to one cart to skew the masses. The velocities of both carts are measured using the cart’s internal position sensors enabling students to determine that momentum is conserved in a linear exploding system.
The player’s force on the basketball will be equal to the opposing force of the basketball onto the player. Of course most students will consider this a ridiculous proposition until they prove this for themselves.
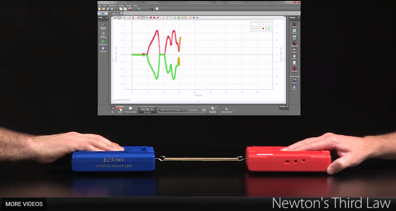
Using Smart Carts to explore Newton’s Third Law
There are several ways the carts can be used. The simplest activity is for two students to have a tug-of-war using the internal force sensors of two Smart Carts and an elastic band as depicted in the image. The equal but opposite forces will be confirmed, however in relation to a basketball player taking a shot, it has some shortcomings as the forces are pulling as oppose to pushing.
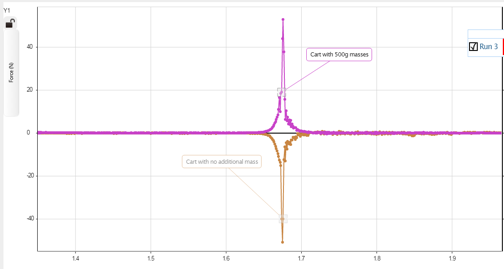
An equally simple activity, and one more relevant to the basketball shot scenario, is to collide two Smart Carts (with magnetic bumpers attached to their force sensors). As both carts have equivalent masses, students may not be surprised to see the impact forces are identical. However, what will probably surprise your students, are the force measurements that occur during a collision when one cart is weighed down with one or more 250g masses. Using their intuition, most students will speculate that one of the carts will experience a much greater force than the other. Of course, Newton’s 3rd Law will triumph and the forces will be identical.
Gravity
What goes up must come down. This is true of course for all earth bound objects (including basketballs) due to the ever present force of gravity. Without gravity the trajectory of a basketball player’s shot would be straight to the ceiling of the arena, where most of the fans would be viewing the game.
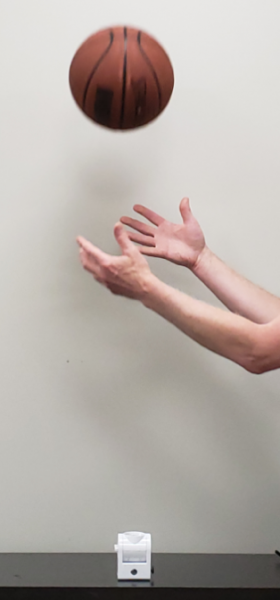
Exploring the accelerating force of gravity using the Motion sensor
PASCO offers several technologies and techniques for measuring gravity including the Wireless Smart Gate and Picket Fence and the new Freefall apparatus. Both of these techniques are accurate and precise means to measure gravity. A third technique and one more appropriate for relating to a basketball shot is to measure the position of a vertically tossed ball and then have the software derive an acceleration graph from this data. Statistics, including the Mean of the acceleration plot can be calculated by the software for the period when the ball was in freefall as shown in the graph.
The average acceleration in the free fall period is approximately -9.5 m/s/s
I recently hosted my first ever professional development event. Usually, at the local level, there aren’t many opportunities for science types. There just aren’t enough of us and we specialize so there isn’t much common talk beyond ‘how can we get the students to love and learn science more?’. That is why I went out of comfort zone to host an event on sensors. I’m still not an expert on my physics equipment from PASCO let along the sensors for the other branches but I thought it was worth the shot.
How do I do a pro-d event that engages the audience? How could I hook the teachers in attendance? The answer was easy. Not for me to stand there and talk at them. No! They needed to do science! They needed to use the sensors. So, that’s what we did.
I set up several stations in my room. One for physics, one for bio, one for chem and outside for earth science. Each station required the use of an appropriate sensor (motion, CO2, pH and weather) and a task. I gave them as little instruction as possible beyond how to use SPARKVue. I wanted them to experience what their students would.
I expected only my department to show up. That is still 13 people. I had middle school and elementary teachers show up as well. How would they do? The hours flew by. I didn’t need to worry about filling the time; we needed more. There was a buzz that you don’t hear at staff meetings. They were engaged. They were loving it. They were hooked on sensors.
What I loved most was the talk on how they could use it for their classes. I wanted to get their ideas because they would know better than I. Every teacher left with an idea on how the sensors could be used…if only we had more.
When the day was over I was asked to host more of these. It was very easy to say yes.
I’ve been a theorist and an experimentalist at different times throughout my career. When at university, theory won out over experimental but now, as a teacher of high school, experimental easily wins. There is nothing like watching students figure out problems, deduce scientific laws and test theories. The old problem was the equipment.
What can I do with ticker-tape?
How responsive are the thermometers?
How reliable is the data?
How big are the errors?
Is it going to work?
But now, with my PASCO equipment, things are changing. I’m more excited and so are my colleagues. The students are picking up on that excitement too. The labs we’ve done for decades are being updated. However, the real joy is in designing new ones.
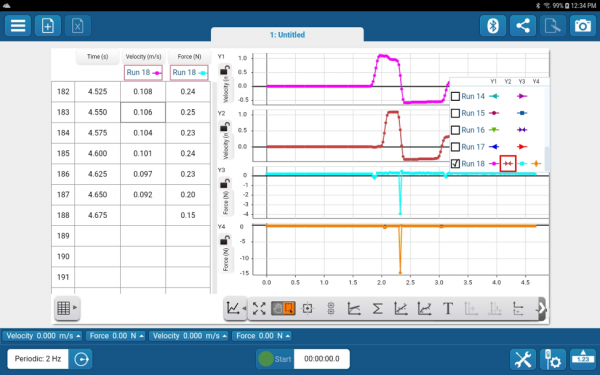
Since September I’ve created three new labs besides updating the other eight I do. One for kinematics, one for gravity and one for momentum. The momentum one is great because we were never able to do a reliable lab before. Using the Smart Carts and Sparkvue the kids are designing safe barriers and analyzing crashes. My favourite part of that lab is having the students figure out if movies are lying to you when they show a person getting shot, flying backwards through a window, and landing a few metres on the other side of it. We can recreate the situation with the Smart Cart acting as the bullet and looking at the forces involved.
This screenshot represents a head-on collision between two smart carts. They were released at different times to offset v-t graphs.
As I was working on the design of the labs and testing them out, my colleagues and administration stopped by. They all wanted to see what I was up to. They could see my excitement. They were infected. Two team members went away and started designing their own labs. We are talking more, sharing more and the kids benefit from it.
We can ask deeper questions because the data is more reliable and relatable. We can do so much with the carts and are figuring out more each time. Labs in physics 12 were hard because of analysis to 2-D. We are creating labs for them. The goal is a least two new labs a month. The labs are also not so cookie-cutter. They don’t always have to be quantitative. They are exploring more and, hopefully, learning more.
All of this is possible because of the Smart Carts, Sparkvue and the joy of lab design.
We are doing another lab today and today we will use the new technology! Cheers erupt from the class.
Yes, for today’s lab there will be no ticker tape. No counting dots! Welcome to SPARKvue! Everybody turn on your Sparks and open the software.
Mr. Grant? Mine says it needs a software update.
Go ahead and do it.
It won’t let me.
Oh, right. I go over and update.
Turn on your smart carts and connect them to SPARKvue.
Mine says it needs a firmware update. Mine too. And me!
Of course. Update all using my phone as it is faster than trying to get the Sparks to do it for some reason.
Are we ready? Allow the carts to roll down the ramp freely. Take data of time, position and velocity. Graph velocity vs time. What sort of shape are we looking for?
Straight lines!
Good. Go for it.
Mr. Grant. We aren’t getting any data.
Is it recording? The button changing from green to red and back again?
Yes.
Let me try…hmm…you are right. Let me see…Oh. You switched it to manual recording. Set it to periodic and try again.
Still nothing.
Let me see again. You have a frequency of 1 Hz. The cart is going too quickly to get data. Change your frequency. Is everybody else getting data?
Yes. Sure. My button isn’t responding.
Try a lighter touch.
Now it is.
Do around 50 runs. Figure out which run is your best one and why.
Does the whole graph need to be straight?
What do you think?
No…?
Right.
Once you have your best run copy down the table and then graph it. Your graph on paper should resemble the one on the Spark.
Do we need to copy down all the data?
How much do you have?
150 points.
<sigh> What do you think?
No…?
Why not?
That is more than need to show the pattern?
Good.
Time to put the equipment away. Please make sure it is turned off. What did we think about the new way of doing the lab?
Let me paint you a picture. Not something physicists normally do but I’ll give it a shot.
I teach in a small town in BC. For most of my career it has been lower on the social-economic scale, a true blue-collar place but things are changing. More and more people are being pushed out of the big cities due to high house prices and ending up here where life is more laid back, more affordable, more idyllic?
Again, for most of my career the supplies I have had access to are the same supplies that came with the school when it was built…back in the 1950s. Trying to modernize my lab has been a challenge but just like the city, things are changing.
I’ve used PASCO products since my university days and have always found them to be intuitive and practical. When I had the chance, I purchased some of their GLX data loggers for demo purposes. I started to show the students the power of probeware and they yearned for more. Yes, I used yearn to describe students. I know, almost unheard of.
When I procured the funding to buy a class set of the GLXs after buying one a year for 5 years I was ecstatic. I called PASCO to order and was told that they were discontinued. I was bummed. What now? They told me about their new product, the Spark LX as a tablet data logger. I was intrigued. Many discussions happened, and I started to get on board. PASCO even took some of my suggestions about what I thought the logger should entail. After months of waiting they finally arrived; just in time for the start of a new school year.
I happily got to setting them all up and preparing their first interactions with the devices. I would use the Match-Graph software to give my physics students some hands-on real life to graph interactions. After a few hiccups of the airlinks needing firmware updates which my school computer wouldn’t allow I had the students head out into the school to test out the Spark and the software.
The looks we got from the other students and staff started as bewilderment. “What is his class up to now?” was heard more than once. My students didn’t even hear. They were too engaged to notice. The beginner graphs which were too hard mere seconds ago were now too easy. Harder graphs please. Harder and harder they went and the more competitive they got. “I’m addicted to this!” one student exclaimed. “I get it now.” Yelled another. They were hooked at first use.
I can’t wait to see how the next experiment goes. This is how technology should work in class. Relating physical experience to life experience to learning.
____
Glenn Grant has been teaching physics, math and science for 20 years in a small town called Mission, BC.
“For most of my career I’ve been using equipment from the 1960s. I was the first person in my district to start using a Smart Board and then started getting into sensors about 10 years ago. Since then I’ve cobbled together whatever I can to give my students access to something from the current century. I believe that technology has a place in the classroom as a tool to further the learning. Using the new PASCO equipment we can do labs 100 times a class and the discussion becomes more in-depth. Why did they choose the data set they are using? What makes that data “better”? Can you replicate the graph on the board using the equipment. It allows for more actual science than just content memorization. As I deepen my understanding of the equipment and its uses, I’ve been teaching the other members of my department and other teachers in the district. I’m not an expert yet but I’m working on it.”
Written by: David King, University of Alberta – Augustana Campus
The Augustana Campus chemistry labs have traditionally been perfectly acceptable, but have yielded somewhat standard chemistry experiments with very typical analysis. As a satellite campus of the University of Alberta, located in Camrose, Alberta, we have strived to be almost an extension of our North Campus sibling, which has proved problematic within the constraints of a 100 kilometers distance. Recently, things have changed. Last summer, we diverged from this straightforward and customary path and decided to do something slightly different. Along with our newly renovated labs—that encourage thought and collaboration—we have fundamentally changed our first-year chemistry lab experiments, which mean that different analyzation techniques are needed. Gone are vitamin C titrations with Tang and tablets, replaced by extraction techniques and spectral analysis. Hand-held spectroscopes have been replaced with a fiber optic cable in a light emissions lab while also adding a light measurement for chemiluminescence.
Our previous vitamin C laboratory experiment was based in a traditional vein, where titrations were used to determine the vitamin C content in both Tang (a powdered orange drink very few students today have ever experienced) and 500mg vitamin C tablets. Being a “traditional” lab exercise meant that most students likely had seen this done in high school or had done this very titration themselves. Our goal was to create an experience where the students learn a new analytical technique by extracting vitamin C from a pepper, then determining the vitamin C concentration from a standard calibration curve on a PASCO Wireless Spectrometer. All of these skills are taught in the first week of this exercise. Week two is all about the inquisitive nature and enthusiasm of the first-year chemistry students. We wanted them to start critically thinking about what they read and whether or not it is scientifically sound, and we also wanted students to gain confidence in their research abilities right away, both in a laboratory setting and with data analysis. The idea is that students would formulate a research question and then create a hypothesis to test in the lab to add to their skills. Since the PASCO Wireless Spectrometers allow us to keep data sets, we could use the same calibration curves throughout the testing.
Student Myths Tested:
Different cooking methods affect on Vitamin C
Different storage methods affect on Vitamin C
Freshly squeezed vs. prepackaged juice
Over the counter vitamin C supplements vs. natural sources
Comparing vitamin C content of fruits and vegetables from different international origins
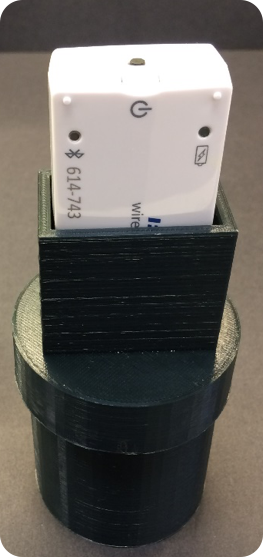
Light emissions lab experiments can be tedious at best. You need to constantly be looking through a hand-held spectroscope, which is exactly what we were asking our students to do. Also, we were looking at lights, flame tests and emission tubes with said spectroscopes. Throughout all of this, we weren’t asking the students to really do anything else, chemically speaking. Chemiluminescence and chromatography columns were two things we decided to add into our updated labs, along with the fiber optic cable accessory for the Wireless Spectrometers (as well as scaling back the spectroscope use). In the first part of our experiment, students would activate a glow stick and add the content to our 3D printed Light Calorimeter, then read the light emitted using the PASCO Wireless Light Sensor. From here, students would take the glow stick content and run it through a silica gel column to remove the chemical that activates the “glow”, then read the light emitted again. Peroxide and sodium salicylate would then be added to get the “glow” to return, and one last reading on SPARKvue would be taken.
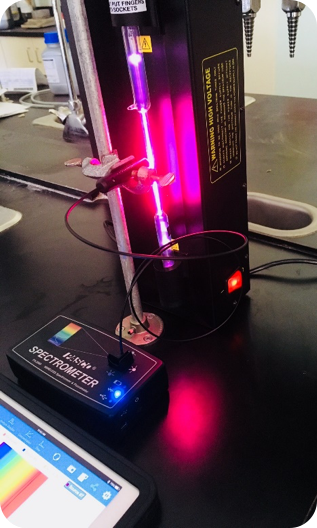
By using this method, we wanted students to learn not only about columns and their ability to separate mixtures but also to get comfortable learning how to collect data using a sensor and a data logger (in this case an iPad). In the second part of our experiment, we still use traditional light emission tubes (Argon, Helium, etc.) where we use spectroscopes to obtain the emission spectrum lines. For the hydrogen tube, however, we set up the fiber optic cable accessory and the PASCO Wireless Spectrometer to get the most precise emission light spectrum we can. Ideally, the students learn both techniques but come away with the appreciation for the newer tech.
Changing these two experiments to incorporate PASCO equipment and using different techniques has allowed the students to get a more modern feel for newer types of equipment and techniques that are more advanced than your “standard chemistry type” experiments.
Since the wireless sensors are easily incorporated into our lab designs, we have set our sights on adding the brand new PASCO Wireless Colorimeter to our forensic based Escape Box Lab to give students an idea how an analysis of this type could be performed in the field.
We also have a unique laboratory based three-week course for non-science majors that utilizes the PASCO Wireless CO2 sensor in an interesting way. Our laboratory future is both bright and innovative, and more importantly, possible, with the tools from PASCO at our disposal.
I scream, you scream we all scream for ICE CREAM!! Everyone loves ice cream and kids love making it.
In this presentation we look at how you can teach some kinetic molecular theory, intermolecular forces and even heats of reaction/calorimetry while making ice cream.
This lesson has been done with grade 9 applied level classes as well as grade 11 University Prep Chemistry. It can easily be tailored for senior physics and chemistry.
Students get a chance to see how state of matter affects temperature (using the PASCO Wireless Temperature Sensor), in real time, and how adding salt to ice can drop the temperature even further even though it is changing into a liquid! We then do some simple calorimetry with different forms of food to get an idea of how much energy is stored in them.
Jason Pilot is currently the Department Head of Science at Sir Winston Churchill C&VI in Thunder Bay, ON. He has been teaching Science for 17 years. Jason focuses on the integration of technology into instruction and assessment incorporated into problem and inquiry based experiential learning.
Bryan Ouellette is an Educator, Explorer and overall technology Enthusiast who enjoys discovering strategies that allow students the opportunity to investigate various concepts through personalized learning. With over a decade of classroom experience, District Lead Positions and Provincial Committees, Bryan is committed to transforming classrooms into an environment where learning happens willingly.
Bryan takes a look at the new PASCO Wireless Weather Sensor, how it works and how it can be used in classrooms. This journey will not only take you from the windy parts of the prolonged winter in New Brunswick, but also to depths of the abilities that this new PASCO Weather Sensor can provide.
The Wireless Weather Sensor with GPS is an all-in-one instrument for monitoring environmental conditions. A built-in anemometer as well as sensing elements for temperature, humidity, pressure, light, and GPS the sensor provides up to 17 different measurements that can be used individually or simultaneously. Use the sensor in logging mode with the optional Weather Vane Accessory for long-term monitoring, or use it as a hand-held instrument to study microclimates and record ambient conditions relevant to many biological and environmental phenomena. Conduct GIS/mapping experiments using the onboard GPS sensor in conjunction with any of the other available measurements. The new map display in PASCO’s SPARKvue software provides a way for students to analyze spatial data.
Your Shopping Cart will be saved and you'll be given a link. You, or anyone with the link, can use it to retrieve your Cart at any time.
Back
Save & Share Cart
Your Shopping Cart will be saved with Product pictures and information, and Cart Totals. Then send it to yourself, or a friend, with a link to retrieve it at any time.
Your cart email sent successfully :)
Marie Claude Dupuis
I have taught grade 9 applied science, science and technology, grade 10 applied, regular and enriched science, grade 11 chemistry and physics for 33 years at Westwood Senior High School in Hudson Québec. I discovered the PASCO equipment in 2019 and it completely changed my life. I love to discover, produce experiments and share discoveries. I am looking forward to work with your team.
Christopher Sarkonak
Having graduated with a major in Computer Science and minors in Physics and Mathematics, I began my teaching career at Killarney Collegiate Institute in Killarney, Manitoba in 2009. While teaching Physics there, I decided to invest in PASCO products and approached the Killarney Foundation with a proposal about funding the Physics lab with the SPARK Science Learning System and sensors. While there I also started a tremendously successful new course that gave students the ability to explore their interests in science and consisted of students completing one project a month, two of which were to be hands-on experiments, two of which were to be research based, and the final being up to the student.
In 2011 I moved back to Brandon, Manitoba and started working at the school I had graduated from, Crocus Plains Regional Secondary School. In 2018 I finally had the opportunity to once again teach Physics and have been working hard to build the program. Being in the vocational school for the region has led to many opportunities to collaborate with our Electronics, Design Drafting, Welding, and Photography departments on highly engaging inter-disciplinary projects. I believe very strongly in showing students what Physics can look like and build lots of demonstrations and experiments for my classes to use, including a Reuben’s tube, an electromagnetic ring launcher, and Schlieren optics setup, just to name a few that have become fan favourites among the students in our building. At the end of my first year teaching Physics at Crocus Plains I applied for CERN’s International High School Teacher Programme and became the first Canadian selected through direct entry in the 21 years of the program. This incredible opportunity gave me the opportunity to learn from scientists working on the Large Hadron Collider and from CERN’s educational outreach team at the S’Cool Lab. Following this, I returned to Canada and began working with the Perimeter Institute, becoming part of their Teacher Network.
These experiences and being part of professional development workshops with the AAPT and the Canadian Light Source (CLS) this summer has given me the opportunity to speak to many Physics educators around the world to gain new insights into how my classroom evolves. As I work to build our program, I am exploring new ideas that see students take an active role in their learning, more inter-disciplinary work with departments in our school, the development of a STEM For Girls program in our building, and organizing participation in challenges from the ESA, the Students on the Beamline program from CLS, and our local science fair.
Meaghan Boudreau
Though I graduated with a BEd qualified to teach English and Social Studies, it just wasn’t meant to be. My first job was teaching technology courses at a local high school, a far cry from the English and Social Studies job I had envisioned myself in. I was lucky enough to stay in that position for over ten years, teaching various technology courses in grades 10-12, while also obtaining a Master of Education in Technology Integration and a Master of Education in Online Instructional Media.
You will notice what is absent from my bio is any background in science. In fact, I took the minimum amount of required science courses to graduate high school. Three years ago I switched roles and currently work as a Technology Integration Leader; supporting teachers with integrating technology into their pedagogy in connection with the provincial outcomes. All of our schools have PASCO sensors at some level (mostly grades 4-12) and I made it my professional goal to not only learn how to use them, but to find ways to make them more approachable for teachers with no formal science background (like me!). Having no background or training in science has allowed me to experience a renewed love of Science, making it easier for me to support teachers in learning how to use PASCO sensors in their classrooms. I wholeheartedly believe that if more teachers could see just how easy they are to use, the more they will use them in the classroom and I’ve made it my goal to do exactly that.
I enjoy coming up with out-of-the-box ways of using the sensors, including finding curriculum connections within subjects outside of the typical science realm. I have found that hands on activities with immediate feedback, which PASCO sensors provide, help students and teachers see the benefits of technology in the classroom and will help more students foster a love of science and STEAM learning.
Michelle Brosseau
I have been teaching since 2009 at my alma mater, Ursuline College Chatham. I studied Mathematics and Physics at the University of Windsor. I will have completed my Professional Master’s of Education through Queen’s University in 2019. My early teaching years had me teaching Math, Science and Physics, which has evolved into teaching mostly Physics in recent years. Some of my favourite topics are Astronomy, Optics and Nuclear Physics. I’ve crossed off many activities from my “Physics Teacher Bucket List”, most notably bungee jumping, skydiving, and driving a tank.
Project-based learning, inquiry-based research and experiments, Understanding by Design, and Critical Thinking are the frameworks I use for planning my courses. I love being able to use PASCO’s sensors to enhance the learning of my students, and make it even more quantitative.
I live in Chatham, Ontario with my husband and two sons.
 I’ve been teaching physics for years and for most of the years that meant one thing: ticker tape. Don’t get me wrong, there is a certain elegance to labs using ticker tape; there just isn’t as much depth. Enter the PASCO Smart Cart and SparkVue software.
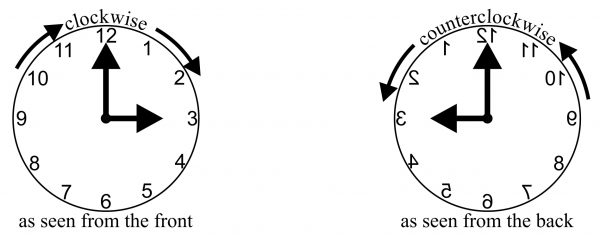
 Gravity
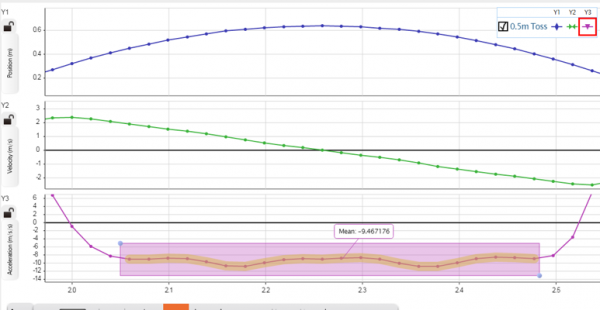
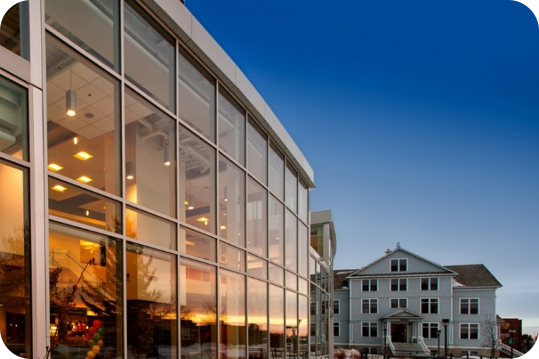 The Augustana Campus chemistry labs have traditionally been perfectly acceptable, but have yielded somewhat standard chemistry experiments with very typical analysis. As a satellite campus of the University of Alberta, located in Camrose, Alberta, we have strived to be almost an extension of our North Campus sibling, which has proved problematic within the constraints of a 100 kilometers distance. Recently, things have changed. Last summer, we diverged from this straightforward and customary path and decided to do something slightly different. Along with our newly renovated labs—that encourage thought and collaboration—we have fundamentally changed our first-year chemistry lab experiments, which mean that different analyzation techniques are needed. Gone are vitamin C titrations with Tang and tablets, replaced by extraction techniques and spectral analysis. Hand-held spectroscopes have been replaced with a fiber optic cable in a light emissions lab while also adding a light measurement for chemiluminescence.
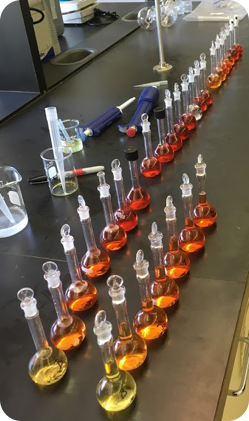 Our previous vitamin C laboratory experiment was based in a traditional vein, where titrations were used to determine the vitamin C content in both Tang (a powdered orange drink very few students today have ever experienced) and 500mg vitamin C tablets. Being a “traditional” lab exercise meant that most students likely had seen this done in high school or had done this very titration themselves. Our goal was to create an experience where the students learn a new analytical technique by extracting vitamin C from a pepper, then determining the vitamin C concentration from a standard calibration curve on a
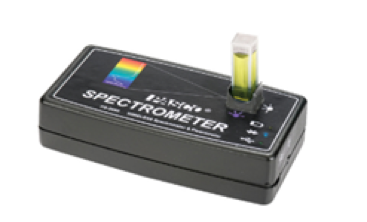
 Light emissions lab experiments can be tedious at best. You need to constantly be looking through a hand-held spectroscope, which is exactly what we were asking our students to do. Also, we were looking at lights, flame tests and emission tubes with said spectroscopes. Throughout all of this, we weren’t asking the students to really do anything else, chemically speaking. Chemiluminescence and chromatography columns were two things we decided to add into our updated labs, along with the fiber optic cable accessory for the Wireless Spectrometers (as well as scaling back the spectroscope use). In the first part of our experiment, students would activate a glow stick and add the content to our 3D printed Light Calorimeter, then read the light emitted using the
 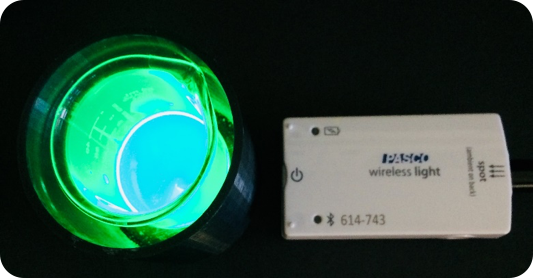 By using this method, we wanted students to learn not only about columns and their ability to separate mixtures but also to get comfortable learning how to collect data using a sensor and a data logger (in this case an iPad). In the second part of our experiment, we still use traditional light emission tubes (Argon, Helium, etc.) where we use spectroscopes to obtain the emission spectrum lines. For the hydrogen tube, however, we set up the
 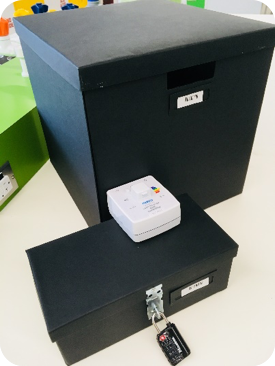 Since the wireless sensors are easily incorporated into our lab designs, we have set our sights on adding the brand new
  We also have a unique