English Français

1-877-967-2726

Chemvue

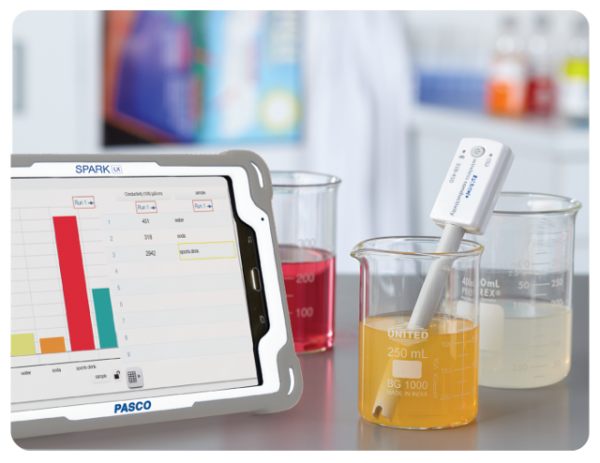
Chemvue is an intuitively designed software for chemistry investigations, programmed with input from faculty for college lab student success. It enables convenient data collection and analysis, elegant college lab report design, and easy export options. Coming soon to your local device.

Our new chemistry application is built with your needs in mind. Measurements begin instantaneously upon pairing sensors to give students immediate digital readouts of the phenomenon they are measuring. The reported units communicate significant figures correctly, and units can be easily converted by a menu drop-down option.


PASCO is looking for University/College chemistry instructors and lab managers to try Chemvue and provide feedback.

Your expertise can shape the future of Chemvue! Follow this link to sign up and join our Chemvue preview group, and feel free to provide feedback using the link within the software.

Register to Preview Chemvue


Already have Chemvue? Interact with a free sample data set!

Download free sample data sets (descriptions below) to analyze and edit on your own! We collected the data here at PASCO, so all you have to do is open the file in Chemvue and begin investigating.

Evaporative Cooling

Explore evaporative cooling rates of methanol, ethanol, and propanol. (Data collected using our Wireless Temperature Sensor.)

Download Data Set

Boyle’s Law

Investigate how gas responds when the volume of its container changes. (Data measured with our Wireless Pressure Sensor.)

Titration Curves

Compare titration curves of various strong and weak acids. (Volume measured using our Wireless Drop Counter.)


Why Chemvue?

Informed UI/UX & Feature Design:

          Designed in collaboration with college chemistry professors.

Innovative Technology Integration:

          Engineered with state-of-the-art data collection and lab reporting.

Improved Investigation & Analysis:

          Envisioned to improve lab efficiencies and student learning.

Chemvue has three methods of data input:

  • Capture real-time measurements from sensors
  • User-entered data
  • Calculations on column data. Analysis calculations allow for finding slope, best fit, area under the curve, and count of events measured in the selection. Communicate your measurements clearly with labels, annotations, and customizable column titles.

Chemvue is compatible with PASCO’s award-winning line of chemistry sensing equipment.

Students can:

  • Measure ion concentrations in solution
  • Determine reaction kinetics by color changes
  • Monitor gas pressure concurrently with volume or temperature changes
  • Log solution volumes to find acid-base strengths
  • Determine solution potentials from their electric potentials
  • Track battery capacity following current levels
  • Investigate nuclear probabilities measuring rates of decay from unstable isotopes
  • And much more

Features

With features designed specifically for chemistry courses, this interface simplifies workflow to maximize student efficiency during lab time.

  • Auto-Configuration

Chemvue recognizes and auto-configures an appropriate page setup based on the device you connect. Did you connect PASCO’s Wireless pH Sensor and Drop Counter? Chemvue recognizes you want to run a titration. Auto-configuration also applies to our spectrometers, colorimeter, Geiger counter, and melt point apparatus.

  • Calibration

Calibration can easily be set via the measurement dropdown menu from the digital display, graph axes, or table headings when sensors are connected.

  • Calculator

Use existing data points to calculate new meaningful values, manipulate data to show linear relationships, or convert measurement units.

  • Number Formatter

Choose significant figures, fixed decimal places, or scientific notation to display your data and edit them anytime.

  • Sampling Options

Choose from a wide range of sampling intervals for data point collection to fit your experimental needs.

  • Export Options

Promote student collaboration with export options at the click of a button. Chemvue supports the sharing of CSV data and PNG images, allowing students to share, analyze, and write up their labs on any device with any software.

  • Dark Mode

Reduce eye fatigue and make your data stand out with Dark Mode; toggle between modes while using the software, and export screenshots with light or dark backgrounds–perfect for presentations.

How Do I? Videos

Follow along with the Chemvue “How Do I?” YouTube tutorial videos to easily navigate Chemvue’s features and displays.

For many more Chemvue “How Do I?” tutorial videos, click the link below.

Video Tutorial Collection

Chemvue Experiments

Explore these college-level General Chemistry lab activities designed to work with Chemvue software.

Physical and Chemical Changes

Kinetics: Reaction Order and Rate Constant

To view more Experiments in the Chemvue Collection, click the button below.

Chemvue Labs for College Chemistry

Data Collection

Connect to a PASCO sensor wirelessly or using a USB cable. Chemvue utilizes the newest Bluetooth® technology, and wireless sensors pair through a simple in-app list so no system settings are required. With multiple sensors in most labs, easily connect the correct sensor from a proximity sorted list of sensors (6-digit laser-etched ID number).

Connect wirelessly to a PASCO sensor
Comparing titrations of several acids helps students understand how concentration, strength and polyprotism impact curve shape and location.
Titration graph showing pH vs. Volume as titrant is added to solution.

Immediately choose from dozens of sensed properties based on which instrument is connected: Temperature, pressure, mass, conductivity, light absorption, gas concentrations (O2, CO2, and ethanol), voltage, current, pH, ion selective electrodes, radiation, sound, humidity and atmospheric conditions. The list of possibilities grows as tools are added to the PASCO line! Easily connect to Chemvue and start capturing values to record on your device for further analysis.

Select regions on your graph to compare values, interpolate data, and explore formulas that best describe the relationship between the variables. Use tools like tangent lines to determine reaction rates, and calculate the area under the curve to determine how much has reacted.

Easily stretch axes scale your graph, drag your graph to areas of interest, or select and zoom in to magnify data points. In-context tools make it simple to find what you’re looking for, which means that students spend their time learning the science, not the software.

Boyles Law showing relationship between volume and pressure of a contained gas.

Data Sharing and Export

When it’s time for students to submit their work, students can easily export an image of their graph, export the data to a .csv file to work in a spreadsheet, or save it in our Chemvue format. This file can be shared by email or sent via bluetooth (whatever your device supports) back to themselves to design their lab write-ups.


Temperature Probe – Chemical Compatibility

A: Excellent,
B: Good,
C: Fair to Poor,
D: Not recommended
Chemical 304 Stainless Steel (PS-2153) 316 Stainless Steel (PS-3201)
Acetaldehyde A A
Acetamide D A
Acetate Solvents D A
Acetic Acid D B
Acetic Acid — 20% B A
Acetic Acid — 80% D B
Acetic Acid — Glacial C A
Acetic Anhydride D B
Acetone A A
Acetone 70°F A A
Acetonitrile (Methyl Cyanide) A A
Acetophenone A B
Acetyl Chloride B B
Acetylene A A
Acrylonitrile A A
Adipic Acid B B
Aero Lubriplate A A
Aerosafe 2300 A A
Aerosafe 2300F A A
Aeroshell 17 Grease A A
Aeroshell 1Ac A A
Aeroshell 750 A A
Aeroshell 7A Grease A A
Alcohol A A
Alcohol: Amyl A A
Alcohol: Benzyl B B
Alcohol: Butyl A A
Alcohol: Diacetone A A
Alcohol: Ethyl A A
Alcohol: Hexyl A A
Alcohol: Isobutyl A A
Alcohol: Isopropyl B B
Alcohol: Methyl A A
Alcohol: Octyl A A
Alcohol: Propyl A A
Alkaline Solutions A A
Allyl Alcohol A A
Allyl Chloride B B
Almond Oil (Artificial) B B
Aluminum Acetate (Burow’s Solution) C B
Aluminum Chloride D C
Aluminum Chloride 20% D C
Aluminum Fluoride D D
Aluminum Hydroxide B C
Aluminum Nitrate A A
Aluminum Phosphate A A
Aluminum Potassium Sulfate D B
Aluminum Potassium Sulfate 10% A A
Aluminum Sulfate B B
Amines A A
Ammonia 10% A A
Ammonia Anhydrous A A
Ammonia Nitrate A A
Ammonia, anhydrous B A
Ammonium Acetate B A
Ammonium Bifluoride D B
Ammonium Carbonate B B
Ammonium Casenite A A
Ammonium Chloride C C
Ammonium Fluoride D A
Ammonium Hydroxide B A
Ammonium Nitrate A A
Ammonium Oxalate A A
Ammonium Persulfate A B
Ammonium Phosphate A A
Ammonium Phosphate, Dibasic B C
Ammonium Phosphate, Monobasic B C
Ammonium Phosphate, Tribasic B B
Ammonium Sulfate B B
Ammonium Sulfite B B
Ammonium Thiosulfate A A
Amyl Acetate (Banana Oil) A A
Amyl Alcohol A A
Amyl Chloride (Chloropentane) A A
Aniline A B
Aniline Dyes B B
Aniline Hydrochloride D D
Animal Fats & Oils A A
Anti-Freeze (Alcohol Base) A A
Anti-Freeze (Glycol Base) A A
Antimony Trichloride D D
Aqua Regia (80%, Hci, 20% Hno3) D D
Arochlor 1248 B B
Aroclor B B
Aromatic Hydrocarbons A C
Arsenic Acid B A
Arsenic Trichloride D D
Asphalt B A
Asphalt Emulsions A A
Atmosphere, Industrial B A
Automatic Brake Fluid A A
Automatic Transmission Fluid A A
Automotive Gasoline (Standard) A A
Aviation Gasoline A A
Banana Oil A A
Barbeque Sauce A A
Barium Carbonate B B
Barium Chloride B C
Barium Cyanide A A
Barium Hydroxide B B
Barium Nitrate B B
Barium Sulfate B B
Barium Sulfide B B
Beer A A
Beer (Alcohol Ind.) A A
Beer (Beverage Ind.) A A
Beet Sugar Liquids A A
Beet Sugar Liquors A A
Benzaldehyde B B
Benzene B B
Benzene Hot B B
Benzene Sulfonic Acid B B
Benzoic Acid B B
Benzol A A
Benzonitrile D D
Benzyl Alcohol A A
Benzyl Benzoate B B
Benzyl Chloride C B
Bleaching Powder (Wet) A D
Blood A A
Blood (Meat Juices – Cold) B A
Borax (Sodium Borate) A A
Bordeaux Mixtures A A
Boric Acid B A
Brake Fluid (Non-Petroleum Base) A A
Brewery Slop A A
Bromine D D
Bromine Dry Gas D D
Bromine Moist Gas D D
Bromine-Anhydrous D D
Bromobenzene B B
Bunker Oil A A
Butadiene A A
Butane A A
Butanol (Butyl Alcohol) A A
Butter C A
Buttermilk A A
Butyl Acetate B C
Butyl Acetyl Ricinoleate A A
Butyl Amine A A
Butyl Benzoate B B
Butyl Ether B A
Butyl Phthalate B B
Butyl Stearate B B
Butylene A A
Butyric Acid B B
Calcium Bisulfide B B
Calcium Bisulfite B A
Calcium Carbonate (Chalk) B B
Calcium Chloride C C
Calcium Chloride Saturated A A
Calcium Hydroxide B B
Calcium Hydroxide 10% A A
Calcium Hydroxide 20% A A
Calcium Hydroxide 30% A A
Calcium Hypochlorite C C
Calcium Hypochlorite 2% Boiling C B
Calcium Nitrate C B
Calcium Nitrite A A
Calcium Oxide A A
Calcium Sulfate B B
Calcium Sulfide B B
Calgon A A
Cane Juice A A
Cane Sugar Liquors A A
Carbitol B B
Carbolic Acid (Phenol) B B
Carbon Bisulfide B B
Carbon Dioxide A A
Carbon Dioxide (dry) A A
Carbon Dioxide (wet) A A
Carbon Disulfide B B
Carbon Monoxide A A
Carbon Tetrachloride B B
Carbon Tetrachloride (dry) B B
Carbon Tetrachloride (wet) A A
Carbonated Water A A
Carbonic Acid B B
Catsup (Ketchup) B B
Caustic A A
Cellosolve B B
Cellosolve, Acetate B B
Cellosolve, Butyl B B
Chloric Acid D D
Chlorinated Water B B
Chlorine (dry) D B
Chlorine (Wet) D D
Chlorine Dioxide D D
Chlorine Trifluoride A A
Chlorine Water C C
Chlorine, Anhydrous Liquid D D
Chloroacetic Acid D B
Chloroacetone B B
Chlorobenzene B B
Chlorobromomethane B B
Chlorobutadiene B A
Chloroform A A
Chloronaphthalene B B
Chlorophenol B B
Chlorosulfonic Acid D D
Chlorosulfonic Acid Dilute D D
Chlorotoluene B B
Chlorox® (Bleach) A A
Chocolate Syrup A A
Chromic Acid – 5% B A
Chromic Acid – 50% C B
Chromic Acid 10% B B
Chromic Acid 30% B B
Chromic Acid Concentrated C C
Chromic Acid Dilute A A
Cider (Apple Juice) A A
Citric Acid B A
Citric Acid Dilute A A
Coca Cola Syrup A A
Coconut Oil (Coconut Butter) A A
Cod Liver Oil A A
Coffee A A
Copper Acetate C C
Copper Chloride D D
Copper Cyanide B B
Copper Fluoborate D D
Copper Fluoride D D
Copper Nitrate A A
Copper Nitrite A A
Copper Sulfate A A
Copper Sulfate – 5% Solution A A
Copper Sulfate >5% B B
Copper Sulfate 5% B B
Corn Oil B A
Cream D A
Creosote Hot B B
Cresols A A
Cresylic Acid A A
Crude Oil A A
Cupric Acid D B
Cupric Chloride B B
Cutting Oil (Sulfur Base) A A
Cutting Oil (Water Soluble) A A
Cyanic Acid A A
Cyclohexane B A
Cyclohexanol B B
Cyclohexanone B B
Denatured Alcohol A A
Detergent Solutions A A
Detergents General A A
Developing Fluids (Photo) A B
Diacetone A A
Diacetone Alcohol B B
Diacetone Alcohol (Acetal) A A
Dibenzyl Ether B B
Dibutyl Phthalate A A
Dibutyl Sebecate A A
Dichlorobenzene A B
Dichlorodifluoro Methane A B
Dichloroethane B B
Diesel Fuel A A
Diethanolamine A A
Diethyl Ether B B
Diethyl Sebecate A A
Diethylamine B B
Diethylene Glycol A A
Diisobutylene B B
Dimethyl Aniline B B
Dimethyl Formamide A B
Dimethyl Phthalate A B
Dioctyl Phthalate A A
Dipentene A A
Diphenyl B B
Diphenyl Ether A A
Diphenyl Oxide B A
Dowtherm Oil A A
Dry Cleaning Fluid A A
Dyes A A
Epichlorohydrin A A
Epsom Salts (Magnesium Sulfate) A B
Ethane A A
Ethanol (Ethyl Alcohol) A A
Ethanolamine A A
Ether A A
Ether Sulfate D D
Ethers B B
Ethyl Acetate B B
Ethyl Acetate 120° F B B
Ethyl Acetate 140° F B B
Ethyl Acetate 70° F B B
Ethyl Acrylate A A
Ethyl Benzene B B
Ethyl Benzoate A A
Ethyl Butyrate A A
Ethyl Cellulose B B
Ethyl Chloride A A
Ethyl Chloride Wet D A
Ethyl Ether B B
Ethyl Formate B B
Ethyl Mercaptan B B
Ethyl Silicate A A
Ethyl Sulfate D D
Ethylene (Ethene) A A
Ethylene Bromide A B
Ethylene Chloride B B
Ethylene Chlorohydrin B B
Ethylene Diamine B B
Ethylene Dibromide B B
Ethylene Dichloride B B
Ethylene Glycol B B
Ethylene Oxide C C
Ethylene Trichloride A A
Fatty Acids B A
Ferric Chloride D D
Ferric Chloride Concentrated D D
Ferric Nitrate B B
Ferric Sulfate B A
Ferrous Chloride D D
Ferrous Sulfate B B
Fluoboric Acid B B
Fluorine C A
Fluorine (Liquid) A A
Fluorine Gas Dry – 300° F A B
Fluorine Gas Wet D D
Fluosilicic Acid C B
Formaldehyde D A
Formaldehyde 40% A A
Formic Acid C C
Freon – Wet C D
Freon 11 A A
Freon 112 A A
Freon 113 A A
Freon 114 A A
Freon 114B2 A A
Freon 115 A A
Freon 12 B B
Freon 13 A A
Freon 13B1 A A
Freon 14 A A
Freon 21 A A
Freon 22 A A
Freon 31 A A
Freon 32 A A
Freon 502 A A
Freon Bf A A
Freon C318 A A
Freon Dry A A
Freon Dry F11 A A
Freon Dry F12, F113, F114 A A
Freon Dry F21, F22 A A
Freon K-142B A A
Freon K-152K A A
Freon Mf A A
Freon Pca A A
Freon TF A A
Freonr 11 A A
Fruit Juice A A
Fuel Oils (ASTM #1 thru #9) A A
Furan (Furfuran) A A
Furan Resin A A
Furfural (Ant Oil) B B
Gallic Acid B B
Gas Natural A A
Gasoline (Aviation) A A
Gasoline (high-aromatic) A A
Gasoline (Leaded) A A
Gasoline (Meter) A A
Gasoline (Unleaded) A A
Gasoline Leaded Refined A A
Gasoline Sour A A
Gasoline Unleaded Refined A A
Gelatin A A
Glucose (Corn Syrup) A A
Glue (PVA) B A
Glycerin (Glycerol) A A
Glycol B B
Glycolic Acid A A
Glycols B B
Gold Monocyanide D A
Grape Juice A A
Grapefruit Oil A A
Grease A A
Grease (Ester Base) A A
Grease (Petroleum Base) A A
Grease (Silicone Base) A A
Helium A A
Heptane A A
Hexamine A A
Hexane A A
Hexanol Tertiary A A
Honey A A
Hydraulic Oil (Petro) A A
Hydraulic Oil (Petroleum Base) A A
Hydraulic Oil (Petroleum) A A
Hydraulic Oil (Synthetic) A A
Hydrazine A A
Hydrobromic Acid D D
Hydrobromic Acid 20% D D
Hydrochloric Acid – 10% D D
Hydrochloric Acid – 20% D D
Hydrochloric Acid – 37% D D
Hydrochloric Acid 100% D D
Hydrochloric Acid, Dry Gas D D
Hydrocyanic Acid B A
Hydrofluoric Acid D D
Hydrofluoric Acid (Conc.) (Cold) D D
Hydrofluoric Acid (Hot) D B
Hydrofluoric Acid 100% D B
Hydrofluoric Acid 20% D D
Hydrofluoric Acid 50% D D
Hydrofluoric Acid 75% D D
Hydrofluosilicic Acid 100% D D
Hydrofluosilicic Acid 20% C D
Hydrogen Chloride Gas Dry A A
Hydrogen Chloride Gas Wet D B
Hydrogen Cyanide B A
Hydrogen Fluoride Anhydrous B A
Hydrogen Gas A A
Hydrogen Peroxide – 10% B B
Hydrogen Peroxide – 100% B A
Hydrogen Peroxide – 30% B B
Hydrogen Peroxide – 50% B A
Hydrogen Sulfide (dry) C A
Hydrogen Sulfide (wet) C A
Hydrogen Sulfide Dry C A
Hydroquinone B B
Hypochlorous Acid D D
Ink (Printers) C C
Iodine D D
Iodoform B B
Isobutyl Alcohol A A
Isooctane A A
Isophorone A A
Isopropyl Acetate C B
Isopropyl Alcohol A A
Isopropyl Chloride A A
Isopropyl Ether A A
Jet Fuel (JP1 to JP6) A A
Jp-1 A A
Jp-2 A A
Jp-3 A A
Jp-4 A A
Jp-5 A A
Jp-6 A A
Jp-X A A
Kerosene A A
Ketchup A A
Ketones A A
Lacquer Solvents A A
Lacquer Thinners A A
Lacquers A A
Lactic Acid B B
Lard B A
Lard Oil (Cold) A A
Lard Oil (Hot) A A
Latex A A
Lauryl Alcohol (N-Dodecanol) A A
Lead Acetate B B
Lead Molten B B
Lead Nitrate B B
Lead Sulfamate C C
Lemon Oil A A
Ligroin A A
Lime A A
Lime Bleach A A
Lime Sulfur A A
Lineoleic Acid B A
Linoleic Acid B A
Lithium Chloride A A
Lithium Hydroxide B B
Lubricants A A
Lubricants (Petroleum) A A
Lubricating Oil A A
Lubricating Oil Di-Ester A A
Lye (Calcium Hydroxide) B B
Lye (Potassium Hydroxide) B A
Lye (Sodium Hydroxide) B B
Lye 10% B A
Lye 50% B B
Lye Concentrated B D
Lye Solutions A A
Magnesium Bisulfate A B
Magnesium Carbonate B B
Magnesium Chloride D D
Magnesium Hydroxide (Milk of Magnesia) B A
Magnesium Nitrate B B
Magnesium Oxide A A
Magnesium Sulfate A B
Maleic Acid B B
Maleic Anhydride A A
Malic Acid A A
Malt Beverages A A
Manganese Sulfate B B
Mash A A
Mayonnaise C A
Mercuric Chloride D D
Mercuric Chloride (Dilute Solution) D D
Mercuric Cyanide C C
Mercurous Nitrate B B
Mercury A A
Mesityl Oxide A A
Methane A A
Methanol A A
Methyl Acetate A B
Methyl Acetone A A
Methyl Alcohol B A
Methyl Alcohol 10% A A
Methyl Amine A A
Methyl Bromide A A
Methyl Butyl Ketone A A
Methyl Cellosolve B B
Methyl Chloride A A
Methyl Chloride (Dry) A A
Methyl Chloride (Wet) A A
Methyl Ethyl Ketone (MEK) A A
Methyl Formate B B
Methyl Isobutyl Ketone (MIBK) B B
Methyl Isopropyl Ketone A A
Methyl Methacrylate B B
Methylamine A A
Methylene Chloride B B
Milk A A
Mineral Oil A A
Mineral Spirits A A
Mixed Acids D D
Molasses A A
Monochloroacetic acid D B
Monochlorobenzene B B
Monochlorodifluoro Methane A A
Monoethanolamine A B
Motor oil A A
Muriatic Acid D D
Mustard D D
Naphtha A A
Naphthalene A B
Napthenic Acid A A
Natural Gas A A
Neatsfoot Oil A A
N-Hexaldehyde A A
Nickel Chloride D C
Nickel Nitrate B B
Nickel Sulfate B B
Nitrating Acid (<15% HNO3) C D
Nitrating Acid (>15% H2SO4) C C
Nitrating Acid (S1% Acid) C A
Nitrating Acid (S15% H2SO4) C C
Nitric Acid – 10% A A
Nitric Acid – 20% A A
Nitric Acid – 25% A A
Nitric Acid – 35% A A
Nitric Acid – 50% B A
Nitric Acid – 70% A A
Nitric Acid (5-10% Solution) A A
Nitric Acid (Conc.) A A
Nitric Acid (Red Fuming) B B
Nitric Acid Dilute A A
Nitrobenzene B B
Nitrogen A A
Nitromethane A A
Nitrous Acid B B
Nitrous Oxide D B
O-Dichlorobenzene B B
Oils: Aniline A A
Oils: Castor A A
Oils: Cinnamon A A
Oils: Citric A A
Oils: Clove A A
Oils: Coconut A A
Oils: Cod Liver A A
Oils: Corn B A
Oils: Cottonseed C A
Oils: Creosote B B
Oils: Crude A A
Oils: Diesel Fuel (20,30,40,50) A A
Oils: Fuel (1,2,3,5A,5B,6) A A
Oils: Ginger D D
Oils: Hydraulic Oil (Petro) A A
Oils: Hydraulic Oil (Synthetic) A A
Oils: Lemon A A
Oils: Linseed A A
Oils: Mineral A A
Oils: Neatsfoot A A
Oils: Olive B A
Oils: Orange A A
Oils: Palm A A
Oils: Peanut A A
Oils: Peppermint A A
Oils: Pine A A
Oils: Rapeseed A A
Oils: Rosin A A
Oils: Sesame Seed A A
Oils: Silicone A A
Oils: Soybean A A
Oils: Sperm (whale) A A
Oils: Tanning A A
Oils: Transformer A A
Oils: Tung (Wood Oil) A B
Oils: Turbine A A
Oils: Vegetable A A
Oleic Acid A A
Oleum 100% (Fuming Sulfuric) A A
Oleum 25% B B
Oleum Spirits B B
Olive Oil B A
Oxalic Acid (cold) D D
Oxygen A A
Ozone B B
Paint Thinner, Duco B A
Paints & Solvents A A
Palm Oil A A
Palmitic Acid B A
Paraffin A A
Peanut Oil A A
Pentane C C
Peppermint Oil A A
Perchloric Acid D D
Perchloroethylene B A
Petrolatum A A
Petroleum A A
Petroleum Ether A A
Phenol (10%) B B
Phenol (Carbolic Acid) B B
Phenol Sulfonic Acid B B
Phosphoric Acid – 20% A B
Phosphoric Acid (>40%) D D
Phosphoric Acid (crude) D B
Phosphoric Acid (S40%) D C
Phosphoric Acid Aerated A B
Phosphoric Acid Air Free D A
Phosphoric Acid Boiling D D
Phosphorous Trichloride Acid A A
Phosphorus A A
Phosphorus Trichloride A A
Photographic Developer A A
Photographic Solutions D A
Phthalic Acid B B
Phthalic Anhydride A A
Picric Acid D D
Pine Oil A A
Plating Solutions – Antimony A A
Plating Solutions – Arsenic A A
Plating Solutions – Brass A A
Plating Solutions – Bronze A A
Plating Solutions – Bronze (Cu-Sn Bronze Bath 160°F) A A
Plating Solutions – Bronze (Cu-Zn Bronze Bath 100°F) A A
Plating Solutions – Cadmium (Fluoborate Bath 100°F) A A
Plating Solutions – Chrome A A
Plating Solutions – Copper (Copper Fluoborate Bath 120°F) A D
Plating Solutions – Gold A D
Plating Solutions – Indium A C
Plating Solutions – Iron A A
Plating Solutions – Lead A C
Plating Solutions – Nickel A A
Plating Solutions – Silver A A
Plating Solutions – Tin B A
Plating Solutions – Zinc A A
Potash (Potassium Carbonate) B B
Potassium Acetate B B
Potassium Aluminum Sulfate D B
Potassium Bicarbonate B B
Potassium Bichromate B B
Potassium Bromide D B
Potassium Carbonate (Potash) B B
Potassium Chlorate B B
Potassium Chloride C C
Potassium Chromate B B
Potassium Cyanide B B
Potassium Dichromate B B
Potassium Ferricyanide B B
Potassium Ferrocyanide B B
Potassium Hydrate A B
Potassium Hydroxide B A
Potassium Hypochlorite D B
Potassium Iodide B A
Potassium Nitrate B B
Potassium Oxolate B B
Potassium Permanganate B B
Potassium Sulfate B B
Potassium Sulfide B B
Potassium Sulfite B A
Propane A A
Propane (Liquified) A A
Propyl Acetate A A
Propyl Alcohol A A
Propylene B A
Propylene Glycol B B
Propylene Oxide A A
Pydraul A A
Pyridine B B
Pyrogallic Acid D B
Pyroligneous Acid (Wood Vinegar) B B
Quinine Bisulfate B B
Quinine Sulfate B B
Rapeseed Oil A A
Rosin B B
Rosin Oil A A
Rum A A
Rust Inhibitors A A
Sal Ammoniac B A
Salad Dressings A A
Salicylic Acid B B
Salt Brine B D
Salt Water C B
Sea Water C C
Sesame Seed Oil A A
Sewage A A
Shellac A A
Shellac (Bleached) A A
Shellac (Orange) A A
Silicone A A
Silicone Oil A A
Silver Bromide D D
Silver Chloride D D
Silver Cyanide A A
Silver Nitrate B B
Soap Solutions A A
Soda Ash A A
Sodium Acetate B B
Sodium Acid Sulfate D B
Sodium Aluminate A A
Sodium Aluminum Sulfate D A
Sodium Bicarbonate A B
Sodium Bichromate B B
Sodium Bisulfate D C
Sodium Bisulfite C B
Sodium Borate C B
Sodium Borate (Borax) B B
Sodium Bromide C C
Sodium Carbonate A A
Sodium Chlorate B B
Sodium Chloride C C
Sodium Chromate B B
Sodium Cyanide A B
Sodium Ferrocyanide B B
Sodium Fluoride D D
Sodium Hydroxide (20%) B B
Sodium Hydroxide (50%) B B
Sodium Hydroxide (80%) D D
Sodium Hydroxide (Caustic Soda-Lye) A A
Sodium Hypochlorite D A
Sodium Hypochlorite (<20%) C C
Sodium Hypochlorite (100%) D D
Sodium Hyposulfate A A
Sodium Hyposulfite D D
Sodium Metaphosphate D D
Sodium Metasilicate A A
Sodium Nitrate B B
Sodium Nitrate Moten B A
Sodium Perborate B C
Sodium Peroxide B A
Sodium Phosphate B B
Sodium Polyphosphate B B
Sodium Silicate (Water Glass) A B
Sodium Sulfate (Salt Cake) B B
Sodium Sulfide B D
Sodium Sulfite D B
Sodium Tetraborate A A
Sodium Thiosulfate B B
Sorghum A A
Soy Sauce D D
Soybean Oil A A
Stannic Chloride D D
Stannous Chloride C A
Starch B B
Stearic Acid B B
Stoddard Solvent A A
Styrene A A
Sugar (Liquids) A A
Sulfate (Liquors) B B
Sulfate Liquor Black B B
Sulfite Liquor B B
Sulfolane D B
Sulfur D D
Sulfur Chloride D D
Sulfur Dioxide D A
Sulfur Dioxide (dry) D A
Sulfur Dioxide Gas Dry A A
Sulfur Trioxide B C
Sulfur Trioxide (dry) D C
Sulfuric Acid (<10%) D C
Sulfuric Acid (10-75%) D D
Sulfuric Acid (75-100%) C D
Sulfuric Acid (cold concentrated) C B
Sulfuric Acid (hot concentrated) D C
Sulfuric Acid Fuming Oleum B B
Sulfurous Acid D B
Syrup A A
Tall Oil D B
Tallow A A
Tannic Acid B A
Tanning Liquors A A
Tar And Tar Oil B A
Tar, Bituminous A B
Tartaric Acid C C
Terpineol A A
Tertiary Butyl Catechol B B
Tetra Ethyl Lead A A
Tetrachloroacetic Acid D D
Tetrachloroethane C A
Tetrachloroethylene A B
Tetrahydrofuran A A
Tetralin A A
Tetraphosphoric Acid B B
Thionyl Chloride D D
Tin Molten C C
Tin Tetrachloride D D
Titanium Tetrachloride B B
Toluene (Toluol) A A
Toluene At 70° A A
Tomato Juice A A
Tomato Pulp & Juice A A
Transformer Oil A A
Transmission Fluid (Type A) A A
Tributyl Phosphate A A
Trichloroacetic Acid D D
Trichloroethane B B
Trichloroethylene B B
Trichloromonofluoroethane (Freon 17) A A
Trichloropropane A A
Trichlorotrifluoroethane (Freon 113) A A
Tricresyl Phosphate B B
Tricresylphosphate B B
Triethanol Amine A A
Triethanolamine A A
Triethyl Phosphate A A
Triethylamine A A
Triphenyl Phosphite A A
Trisodium Phosphate B B
Tung Oil A B
Turbine Oil A A
Turpentine A A
Urea B B
Uric Acid B B
Urine A A
Vanilla Extract A A
Varnish A A
Vegetable Juice A A
Vegetable Oil A A
Vegetable Oil (Hot) B B
Vinegar B A
Vinyl Acetate B B
Vinyl Chloride B A
Water A A
Water, Acid Mine B B
Water, Boiler Feed A A
Water, Brackish A A
Water, Deionized A A
Water, Demineralized A A
Water, Distilled A A
Water, Fresh A A
Water, Salt C C
Water-Brine, Process, Beverage B B
Waxes D A
Weed Killers A A
Whey A A
Whiskey A A
Whiskey & Wines A A
White Liquor (Pulp Mill) B A
White Water (Paper Mill) A A
Wine A A
Wood Pulp A A
Xylene B B
Zinc Carbonate B B
Zinc Chloride D D
Zinc Cyanide A A
Zinc Hydrosulfite A A
Zinc Molten D D
Zinc Nitrate A A
Zinc Sulfate B A

Monitoring the Solar Eclipse Using PASCO Sensors

Last Monday, on April 8th we were lucky enough to witness the rare phenomenon of a complete solar eclipse. Before the eclipse we set up many different PASCO sensors to see how it affects different environmental factors. We set up PASCOs Wireless Weather Sensor with GPS, Wireless Temperature Sensor, and Wireless Light & Colour Sensor.

The weather sensor was set up to remote log from 10am until 4:30 pm at a sample rate of 1 second. After data collection we graphed the absolute humidity (g/m^2), relative humidity (%), and the UV Index in SPARKvue. As you can see around the time when the partial eclipse starts the UV index begins to fall and the relative humidity begins to increase. At the moment of complete totality UV index hits its minimum value of 0 and the relative humidity hits a maximum of 60%. Much like the UV Index absolute humidity begins decreasing at the time of the partial eclipse, however it hits its minimum value of 4.0 g/m^2 before the moment of complete totality.


Unlike the Wireless Weather Sensor both the Wireless Temperature and Light & Colour Sensors were set to remote log from 12 pm to 4:30 pm. The Wireless Temperature Sensor begins to increase from around 12- 2pm, at the beginning of the partial eclipse (140 on the X-axis) there is already a slow decrease down from a high of 14.6℃. The temperature reaches its lowest value 7.8℃ a few minutes after complete totality.


The Wireless Light & Colour Sensor showed some of the most interesting and instantaneous effects of the eclipse. Both red and blue light are rather consistent in their readings until the moment of totality where there is a sharp decrease in the % of red light and a Sharp Increase in the percentage of blue light. Both illuminance and white light follow a similar pattern of a parabolic shape, both reaching a minimum value of 0 at the moment of totality


Many thanks to PASCO sensors, whose contribution was integral to the success of this project! Their sensors enabled us to gather precise data effortlessly, minimizing the need for constant supervision. PASCO’s sensors serve as ideal educational tools for classrooms, helping students grasp fundamental concepts across physics, chemistry, and biology.

Featured Products:

Wireless Temperature Sensor

Wireless Weather Sensor with GPS

Wireless Light & Colour Sensor 

Eclipses and Animal Behavior

A solar eclipse catches the attention of people for its beauty and awe, but we might not be the only ones who notice. Many animals also recognize a change in their environment. As the sky darkens and the temperature drops, some species behave peculiarly.

Keeping Your Pet Safe

Worried that your pet will get scared during the eclipse?

It is unlikely that dogs and cats will react to solar eclipses, as they typically do not have a strong biological or behavioral response to changes in light or natural phenomena like eclipses.

However, it is possible that some dogs or cats may become confused or disoriented by the sudden change in light, especially if they are outside during the eclipse. Also, excited crowds can cause anxiety for some pets, so be careful about bringing your furry friend along if you decide to view the solar eclipse from a public place.

To ensure your pet’s safety and comfort during an eclipse, it is generally best to keep them indoors or in a calm, secure environment. You may also want to consider providing your pet with distractions such as toys or treats to keep them occupied and help them feel at ease.

Visit our eclipse page for information on when and where to view upcoming solar eclipses!

Wildlife Reactions to a Solar Eclipse

Wild animals tend to have more overt responses to eclipses than our domestic companions. Some animals may become disoriented or confused by the sudden change in light, while others may simply adjust their activities to the altered conditions.


For example, some birds may stop singing during an eclipse, return to their nests, or stop flying. Researchers reason this is likely because they perceive the darkness as a signal that it is time to roost for the night. Animals that usually start stirring at sunset like frogs and crickets may start to chirp. Some spiders may take down their webs, only to rebuild them again when the sunlight returns. Nocturnal animals such as bats and owls may become active during the eclipse, while diurnal animals such as squirrels and deer might be more active just before and after the eclipse.


In some cases, animals may exhibit unusual or even erratic behavior during an eclipse. For example, researchers have observed ants and bees behaving as if it is nighttime during a total solar eclipse, even though it is still light enough to see. One study during the 1984 eclipse watched as chimpanzees at the Yerkes Regional Primate Research Center climbed up their enclosure as high as they could and turned to face the sky.

In a study conducted during the 2017 eclipse at the Riverbanks Zoo in South Carolina, researchers found that 76% of the animals they observed exhibited a behavioral change in response to the total eclipse. Most of these behaviors were typical of the animal’s evening routine.


Some of the behaviors, however, indicated some level of anxiety for the animal. For instance, a head male gorilla charged his glass enclosure, and one male giraffe proceeded to sway his entire body, including his neck, back and forth. Strangely, all the baboons ran around their pen together as totality approached, despite having just been in two separate groups. Once totality passed, they stopped running and returned to their previous arrangement. Flamingos also behaved out of character, huddling together on an island in the center of their enclosure and remaining still. As totality waned, the flock dispersed to their usual groups.

The response of animals to solar eclipses is complex and varies depending on a variety of factors, including the species, their natural behaviors, and the specifics of the eclipse itself. So, while enjoying the wonder of a solar eclipse, take note of any animals around you–you might spot some interesting behaviors!

Want to measure light and temperature during an upcoming eclipse for yourself? Check out our collection of free eclipse activities, or learn how to build your own pinhole projector with our DIY Eclipse Handbook.

Order PASCO Eclipse Glasses HERE!

History of Solar Eclipses

Solar eclipses have fascinated humans for thousands of years, and many ancient cultures have developed their own myths and legends to explain these rare astronomical events.


Early Explanations

One of the earliest known records of a solar eclipse comes from the ancient Chinese, who recorded an eclipse in 2136 BCE. They believed that a dragon was devouring the Sun, and civilians would make loud noises and bang on pots and pans to scare it away.

In ancient Greece, the philosopher Anaxagoras correctly predicted a solar eclipse in 478 BCE. He was the first to suggest that the Moon shines by reflecting light from the Sun, and he was imprisoned for this proposal. His research led to his discovery that eclipses are caused by the Moon blocking the Sun’s light when it passes in front of it. However, his scientific explanation for the phenomenon was not widely accepted until centuries later.

Another Greek philosopher, Aristotle, later refined this theory, explaining that the Earth was at the center of the universe and that the Moon’s orbit was slightly tilted relative to the Earth’s orbit around the Sun. This meant that eclipses occurred when the Moon passed directly between the Sun and Earth, casting a shadow on the planet.

The ancient Maya of Central America were also skilled astronomers and recorded solar eclipses in their calendars. They believed that the eclipses were a sign of impending doom, so they would perform elaborate rituals to appease the gods.

In the Middle Ages, Islamic astronomers developed more accurate models of the movements of the Sun, Moon, and planets. The Persian astronomer Al-Battani, for example, refined the earlier Greek models, proposing that the Moon’s orbit around the Earth was elliptical rather than circular.

By the time of the Renaissance, scientists had developed even more sophisticated theories to explain eclipses, incorporating ideas such as the rotation of the Earth and the elliptical orbits of the planets.

Today, astronomers have a detailed understanding of the mechanics of eclipses, and are able to predict the exact timing and location of these rare astronomical events with great precision. Solar eclipses are still a source of wonder and fascination, and astronomers and scientists continue to study them to gain a better understanding of our universe.


Famous Eclipses

Eclipses that make it to the status of “famous” are generally those that have led to scientific discovery. Some, though, were noted for the sheer number of people who witnessed them.

One of the first recorded eclipses was the Thales of Miletus Eclipse in 585 BCE. The ancient Greek philosopher Thales of Miletus correctly predicted the solar eclipse would occur during a battle between the Lydians and the Medes; however, historians debate the exact year the eclipse occurred, and Thales’ method to predict the event remains uncertain. Regardless, upon observing the phenomenon in the sky, soldiers on both sides laid down their weapons and called a truce to end the war.

In 1715, the famous astronomer Edmund Halley (of Halley’s comet) correctly calculated the event of a solar eclipse within four minutes over England. Halley used Isaac Newton’s newfound theory on gravitation for his prediction, and he’s credited with funding the publication of Newton’s work in the Principia.

The Total Solar Eclipse of 1919 is famous for providing the first experimental evidence for Einstein’s theory of general relativity; Einstein predicted that some stars would appear in a different position in the sky during the eclipse due to the Sun’s gravity bending the starlight. Astronomers observed this shift in position to be accurate, and Einstein published his complete theory soon after.

The Solar Eclipse of August 11, 1999 was the first visible total solar eclipse in the United Kingdom since 1927, and the first visible in Europe in nearly ten years. It was one of the most photographed eclipses in history, viewable to over 350 million people.

The Great American Eclipse of 2017 was a total solar eclipse that was visible–at least partially–across the entire United States. Millions of people watched, as it was the first total solar eclipse to span the United States since 1918.

Fruit Battery Experiment

Using PASCO’s wireless voltage and current sensors, we conducted the fruit battery experiment. We tested 7 different kinds of produce to try and determine which one had the highest electric charge, and would make the best battery.

With these sensors you are able to chart and record voltage and current data right in SPARKvue! Then you can compare and contrast the data recorded across multiple different kinds of produce.

Using copper wire and a zinc coated nail, we connected an orange, clementine, lemon, lime, potato, sweet potato and apple to the sensors and charted their volts and milliamps.

We hypothesized that the lemon would have the highest voltage, due to the fact that it is an extremely acidic fruit. The lime is also an acidic fruit, so that was an alternate option that was considered. Due to the fact that the lemon was a larger fruit, and would maybe be able to hold more charge, we picked the lemon for our theorized winner.

We set the voltage and current sensors to the manual data sampling option so that we could choose when to record data and input it into the table when the voltage and amperage stabilized. We then made an incision in the fruits to insert the copper wire, and pushed the zinc coated screw into the produce. With the citrus fruits, we needed to roll them on the table to get the juices flowing inside of it and gain more acid for the zinc to interact with, making the battery stronger.  After connecting the sensors to SPARKvue, and connecting the negative and positive wires to their proper nodes, we were able to record data for all 7 items into the chart. With SPARKvue we could measure, record, and compare data all in one place.

What may seem like similar results between all the produce is far from ambiguous as by nature the results will be similar between the produce, but there are still outliers that stand out. This experiment allows students to engage in a fun activity by hypothesizing which produce would be the best battery. It makes for a perfect opportunity for your student scientists to strengthen their critical thinking skills and increase their scientific knowledge on electricity!

To advance upon this already fascinating experiment, try connecting an LED in series or in parallel, and see how many fruits it takes to light it up! Have students experiment and determine the best approach to make the LED nice and bright! You can connect multiple LEDS, and multiple fruits, and even compare your voltage and amperage after powering an LED to see if anything has changed!

How The Battery Works

The specifics of the science behind fruit batteries is similar for all types of produce, in using the transfer of negative electrons for creating an electrical current. Specifically in the case of the lemon, it reacts with the zinc and loosens electrons. Copper pulls electrons more strongly than zinc, so negative electrons will move towards the copper when the electrodes are connected by wires, while the positive electrons remain inside the fruit. Moving electrons are called an electric current, so when the electrons move through the wires a charge is detected!


Materials Used:


Growing Tomatoes With the Greenhouse Sense & Control Kit

Over the last couple of months, AYVA Educational Solutions has been growing tomato plants from the Let’s Talk Science Tomatosphere project. In this project, you are given two unknown packets of seeds, labeled T and U. One packet of seeds have been to space, while the other has not. The purpose of this experiment is to germinate and grow the tomato plants from both packets, tracking their growth, and hypothesizing which plants are the space seeds! You can guess which ones you think are the space seeds in the survey at the bottom of this post! Submit your hypothesis and you will automatically be entered into a raffle to win a free PASCO Wireless Temperature Sensor! If you would like to find out which seeds have been to space we encourage you to participate in this fantastic program!! Sign up for your own packet of seeds here.

We used PASCO’s ST-2997 Greenhouse Sense and Control Kit to monitor and regulate conditions for optimal growth! By researching the optimal growing conditions for a tomato plant, we adjusted the levels of the greenhouse system to meet those needs.

Using Blockly, we block coded the Greenhouse conditions we desired, programming a 24 hour sunlight and watering cycle, and ensuring the temperature stayed at 23 degrees Celsius at all times. Once the code was exported into the //control.Node, we planted 3 seeds from each packet on the appropriate sides (T or U).

We tracked the growth of our plants from January 20th to March 31st, as they developed, they went from seeds to leafy plants.

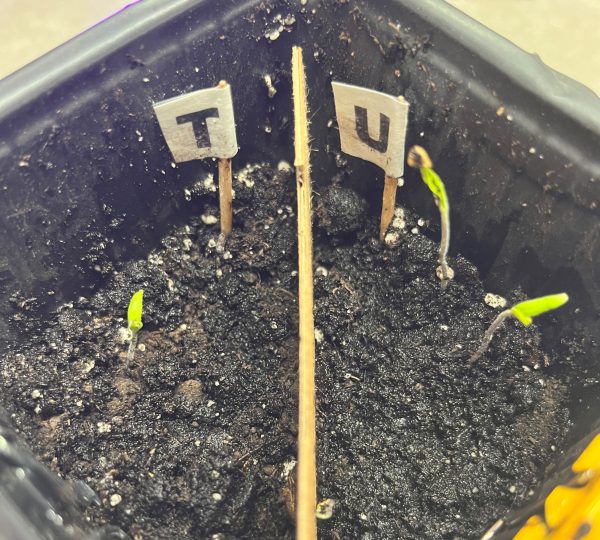
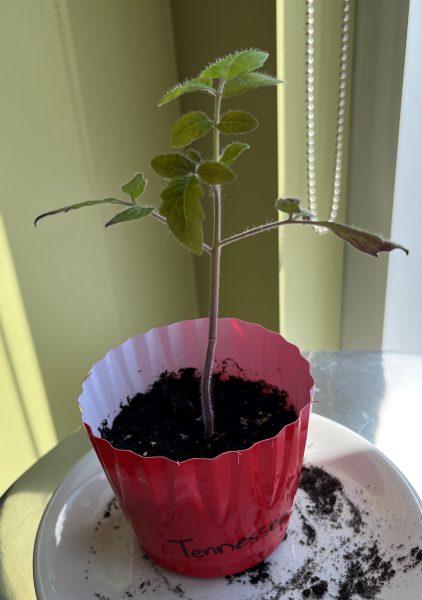
After just one week of being inside the Greenhouse, three out of six seeds germinated and sprouted! As a couple more weeks went by, two more seeds sprouted. Unfortunately, one seed (on the T side) did not germinate. Overall totaling three plants on the U side, two on the T side. At this point, we hypothesized which of the seeds had been to space and which had not, and wrote down our predictions to compare to the results later on. You can share your predictions in the survey at the bottom of this post, and find out which seeds were the space seeds!

In the fourth week of growth we decided to name the plants so that they could be more easily identified, charted, and referred to. On the U side, we named the tomato plants Tennessee, Toby, and Tiny Tim. Then on the T side, we named the plants Thiara and Theodore. Tiny Tim was the smallest plant during the beginning of the growth period, while Tennessee was the largest of the seedlings. Thiara also germinated the latest of any of the seeds, excluding the one seed that never sprouted. She quickly caught up to the others though, and in the 4th week she was the 3rd tallest of them.

After 6 weeks of growth, the plants were beginning to falter as they combatted against one another for nutrients and water. To replenish what they lost, we decided to separate the plants. Three of the plants, Tennessee, Tiny Tim and Thiara were moved to their own pots. However, Toby and Theodore remained in the self-regulating greenhouse to continue identical conditions. Within days of separating the plants, they all began to look healthier as they received the nutrients and space that they needed.

Into the ninth week of the experiment, the plants are growing taller and broader. Now that they each have their own space, they are able to thrive. The featured photo on the right shows Tennessee healthy and strong! With no one contesting him for nutrients, he is tall, green and healthy. At this point, they are almost fully mature, and will be entering the flowering stage shortly. This week we decided to reveal the answer to the lingering question we had been wondering for months – which seeds had been to space? Was it Theodore and Thiara (T Side)? Or perhaps did Toby, Tiny Tim and Tennessee (U side) spend some time in space? Find out the answer below!

Shoutout to the PASCO Greenhouse, as this project could not have been as successful without it! The self-regulating greenhouse allowed us to grow the plants healthy and strong -with minimal intervention from us. We were able to germinate 5/6 seeds and maintain the ideal moisture and temperature levels for the plants to grow, even amidst a cold and dark winter with many days out of the office. PASCO’s Greenhouse is the perfect educational kit for your classroom, teaching students several ecological concepts such as photosynthesis, anatomy of plants, and the ways different conditions affect the growth of plants – all with the new focus and importance of coding. You can start the Tomatosphere project yourself, and facilitate it with the Greenhouse Sense and Control Kit as well.

Make sure to answer the survey below to find out which seeds have been to space and for a chance to win a PASCO Wireless Temperature Sensor! We would love to hear what you think, so share your guesses with us, and your reasoning if you have any!


Featured Products:

PASCO ST-2997 Greenhouse Sense and Control Kit

SPARKvue

Wireless Temperature Sensor


Wireless Sensors are Now Stocked in Oakville!

Here are just a few of the products currently available! If you need something quickly, please give us a call @ 877-967-2726. We can ship across Canada for delivery within a few days for all Canadian stocked items.

Also in-stock & on sale!!

Many of PASCO’s wireless sensors are now stocked in Oakville, Ontario.

Smart Carts
Red: ME-1240
Blue: ME-1241

Wireless pH Sensor
PS-3204

Wireless Light Sensor
PS-3213

Wireless Temperature Sensor
PS-3201

Wireless Sound Sensor
PS-3227

Wireless EKG Sensor
PS-3236

Wireless Spirometer
PS-3234

Wireless Force Sensor
PS-3202

Wireless Soil Moisture Sensor
PS-3228

Airlink
PS-3200

Wireless Acceleration Sensor
PS-3223

Wireless Colorimeter
PS-3215

Wireless Pressure Sensor
PS-3203

Wireless Rotary Motion Sensor
PS-3220

Wireless Temperature Link
PS-3222

Wireless Conductivity Sensor
PS-3210


pH Probe Storage Solution

How do I make a pH probe storage solution to replace any spilled from the probe’s storage bottle?

This solution is appropriate for any of PASCO’s sensors with pH probes, including the pH (PS-2102), Water Quality (PS-2169), Chemistry (PS-2170), Advanced Chemistry (PS-2172) sensors Advanced Water Quality Sensor (PS-2230), and the PS-3204 Wireless pH Sensor.


Physics in Soccer: World Cup 2022

The 2022 World Cup has officially begun, and there’s never been a better time to explore the physics of soccer (or in Europe, football) with your students! From predicting the outcome of a crossbar challenge to understanding the science behind Ronaldo’s famous knuckleball free kick, physics plays an important role in determining which team rules the pitch.

Throughout the World Cup, we’ll be sharing soccer-themed content to help you bring the excitement of the World Cup into your physics course. In our first segment, we’ll explore the physics of soccer’s most infamous pre-match event: the crossbar challenge.

The Physics of Soccer: Crossbar Challenge

The crossbar challenge is a popular pre-game competition held between players from opposing teams. To compete, players take turns kicking soccer balls into the crossbar of a goal. The player who hits the crossbar the most wins the crossbar challenge. Seems simple enough, right? Well, not exactly!

In reality, the crossbar challenge is, well, challenging. The average player is lucky to land two of their five shots, which makes the five-for-five performances of superstars like Neymar Jr. all the more impressive. In fact, Neymar’s success in crossbar challenges is so repeatable that it begs the question: what is Neymar doing that other soccer players aren’t? (Check out this video to see Neymar demonstrate his technique in a crossbar challenge against two other professional soccer players.)

As it turns out, there is a secret to Neymar’s success: physics! When a player kicks a soccer ball, its landing position is largely determined by both the aerodynamics of the ball and the angle, direction, and velocity of the player’s kick. If we ignore aerodynamics for a moment (more on that later), then the crossbar challenge becomes a real-world example of projectile motion.

Incorporate the World Cup into your physics course with these soccer-themed projectile motion problems! Download the student worksheet for free below.

Celebrate the World Cup with these Soccer-Themed Practice Problems!

Download the free Physics in Soccer student handout and answer key below.


1. While warming up for a match at the World Cup, Neymar challenges Aleksandar Mitrović to a crossbar challenge. Both players must take their shot 11 meters away from the goal, but the angle and speed of their kicks can vary. The crossbar is 2.4 meters above the ground. Assuming air resistance is negligible, answer the following questions:

a. If Neymar kicks the ball at a 40° angle, and it takes .87 seconds to hit the crossbar, what must the initial speed of the ball be?

b. Mitrović launches the ball at a 41° angle with a velocity of 18.4 m/s. It flies through the air, passing 1 meter above the crossbar. How long is the ball in the air?

c. Challenge Question: The next round, Mitrović kicks the ball with an initial velocity of 21.0 m/s. Determine the minimum and maximum kicking angles required for the ball to make contact with the crossbar.


2. During a World Cup match, Lionel Messi kicks the ball at a 45° angle from ground level. It reaches a maximum height of 3.2 meters and lands 22.7 meters down the pitch. Assuming air resistance is negligible, answer the following questions:

a. What is the initial vertical velocity of the ball?

b. How long does it take for the soccer ball to reach the ground?

c. What is the initial horizontal velocity of the ball?


3. When the soccer ball leaves the field during a match, a corner kick is performed to restart the game. To perform a successful corner kick, the player must kick the ball at just the right angle, so that it bypasses opponents and lands near teammates. During a practice session for the World Cup, Cristiano Ronaldo makes a corner kick at a 42° angle, launching the soccer ball with an initial velocity of 26 m/s. Assuming the ball travels with projectile motion and air resistance is negligible, answer the following questions:

a. At what time does the soccer ball reach its peak height?
b. What is the maximum height reached by the soccer ball?


4. While practicing for the World Cup, Kylian Mbappé kicks the ball from the ground at a 41° angle. As the ball launches with an initial speed of 28.5 m/s, an opponent 54 meters away at the opposite side of the soccer field begins running to get the ball. What is the average speed he must maintain in order to make contact with the ball just before it hits the ground?


File Attachments

Physics in Soccer: Projectile Motion Problems – Student V File Size: 81.32 KB
Physics in Soccer: Projectile Motion Problems – Editable File Size: 37.64 KB
Physics in Soccer: Projectile Motion Problems – Answer Key File Size: 55.11 KB
Save & Share Cart
Your Shopping Cart will be saved and you'll be given a link. You, or anyone with the link, can use it to retrieve your Cart at any time.
Back Save & Share Cart
Your Shopping Cart will be saved with Product pictures and information, and Cart Totals. Then send it to yourself, or a friend, with a link to retrieve it at any time.
Your cart email sent successfully :)