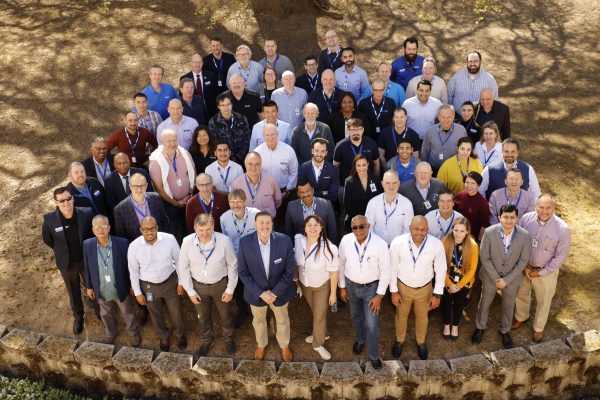
Last week saw delegates from more than 40 different countries gather at PASCO’s head office in California to share success stories about how educators are using PASCO solutions to acheive their STEM goals. I was excited to see several new pieces of equipment including sensors for all sciences.
Wireless Sound Sensor (PS-3227) This is a wireless Bluetooth sensor that connects to any device loaded with either Sparkvue or Capstone software. As is the case with other Pasco wireless sensors this sensor is more powerful than the older sensor it replaces. It can be used to measure sound levels in decibels as well as to show the waveform of a sound in addition to an FFT display to show the frequencies present.
In the recent past when I have worked with teachers to design a physics lab most of the sensor requirements can be filled by Pasco’s new line of wireless sensors, including the smart cart. I then recommend that they consider purchasing at least one 550 or 850 universal interface so that they can use the ScienceWorkshop sound sensor to study sound waves and FFT displays. In addition the built-in signal generator will allow them to generate sine waves over a large frequency range. The AC/DC module described below can carry out this signal generator function. Thus, purchasing the wireless sound sensor and the wireless AC/DC module much of the work formerly left to the 550 can now be accomplished by the less expensive wireless units.
Wireless AC/DC Module (EM-3533)
This wireless module connects via Bluetooth to any device loaded with Capstone or Sparkvue. It connects nicely with other modules in the modular electricity package giving teachers the choice of using this rather than purchasing batteries.
As shown in the video this unit can produce DC output as well as sine, triangle and square waves.
Blockly Coding
The most recent versions of Capstone and SPARKvue include the ability to carry out Blockly coding. This coding can be used to control connected sensors and to react to measurements that they are making. It introduces students to coding as they use sensors to explore various science topics. It exposes them to logic that they are likely to encounter later in life if they pursue science and/or technology and so it becomes an important part of the STEM experience we try to generate for our students.
To make it easier to introduce students to Blockly coding PASCO has developed the //code.Node (PS-3231). It includes the following built–in sensors: magnetic, motion, light, temperature, and sound.
Bill Konrad is a former Teacher and Science/Technology Consultant in South Western Ontario and currently supports AYVA’s customers as a PASCO Product Specialist. Details on how to reach Bill directly can be found here.
Sheridan College (Davis Campus) conducted their 3rd annual Skills Competition on March 4th, 2020, a day dedicated to recognize and celebrate the accomplishments of the students from various programs within the Faculty of Applied Science and Technology. Previously, professors selected their top students to compete in the Skills Ontario competition but with Sheridan’s new Skills Trade Centre, a more engaging way to select the students was brought forward.
Participants choose one stream and put their skill and knowledge to the test while engaging in a friendly competition with their peers. Some of the various streams included electrical engineering, information technology, precision machining, computer engineering, media management, web design, and welding.
AYVA was proud to be a sponsor for this years’ event. It was an honour to be able to witness the extraordinary projects presented by the students.
At the end the competitions, students and sponsors were gathered together for the presentation of the awards.
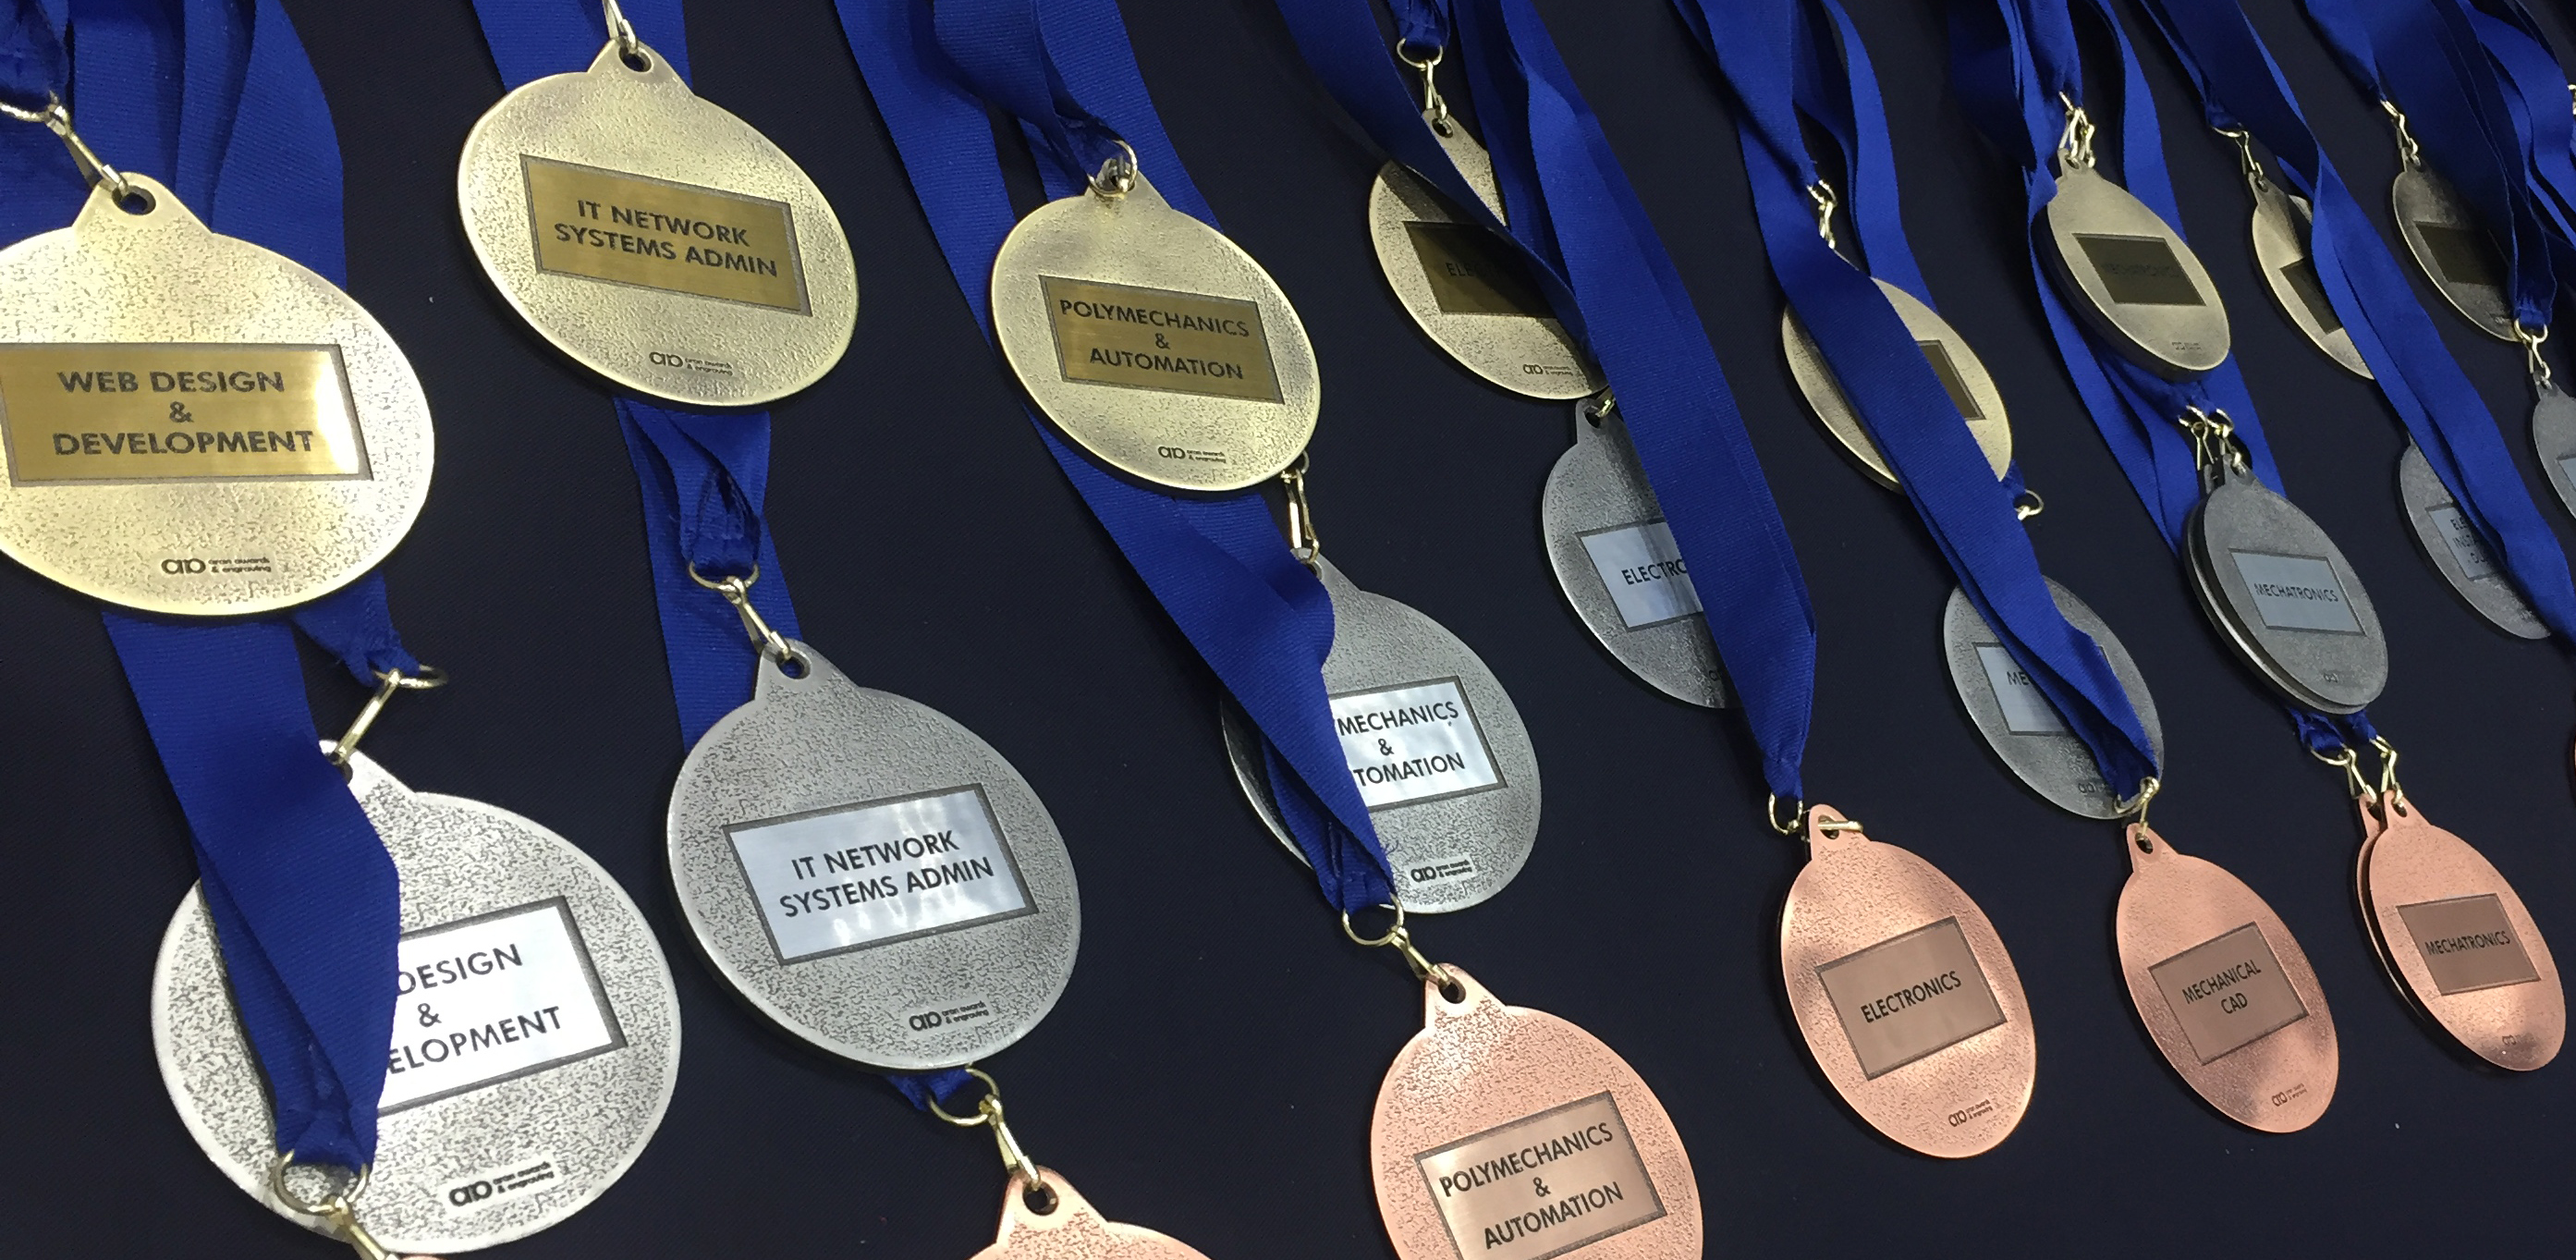
First, second and third place medals (which are made by the skills trade facility!) are awarded to the students.
Congratulations to all the winners and participants in this year’s competition!
Projectiles is a major concept in every physics class, but finding a lab activity to demonstrate this concept can be quite difficult. I have tried a number of ideas in the past, such as rolling balls off tables, firing nerf guns (that seem to never shoot consistently), launcher-building competitions, and so many more. While these activities were okay, they were all limited in terms of measurable variables. The projectile problems I give my students often have some sort of initial “launch” velocity, proves to be the hardest thing to measure in a practical setting.
With the Wireless Smart Gate, this is no longer an issue. The Smart Gate will seamlessly measure the speed of any object that passes through it. Now when my students roll a ball off a table, the ball travels through a Smart Gate first giving them the speed at which the ball leaves the table. Before the Smart Gates, students would have to predict the speed of the ball based on the ball’s range, but they never had a value to compare their predictions with. The Smart Gate allowed for a comparison and when students compared their values, they were amazed at how a value calculated on paper translated into a real-world measurement.
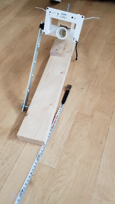
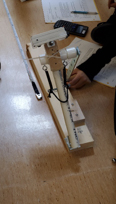
Angled launches remained a stumbling block for me. Rolling a ball through a Smart Gate is easy but launching one through? Pasco has angled projectile launchers available to purchase, but I thought I would build my own to see how feasible it would be to have my students eventually build the same. I wanted a product that would launch a ball through the smart gate at various angles so that students could see how the launch angle and speed affects ball flight.
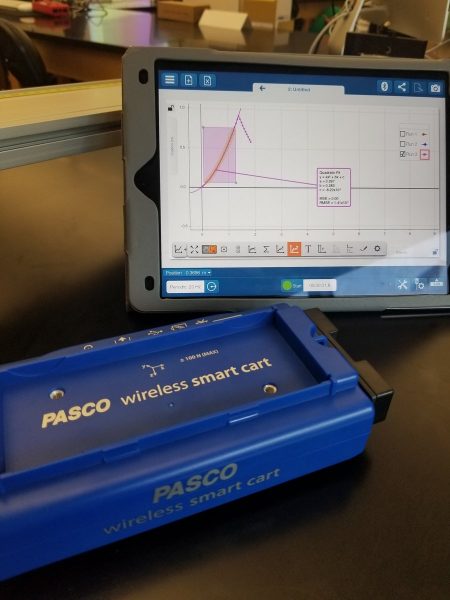
The following pictures are of the finished product. The ball is loaded in the top of the pvc pipe where it rests on a bolt. The bolt is attached to two springs so that when it is drawn back and released, the ball is launched. The video shows the launcher in action. You can see how, as the ball moves through the smart gate, the Smart Gate automatically records the velocity of the ball. The dual beam technology in the new Smart Gate allows for different sized balls to be used, as the velocity is based on the time difference between the two beams. The old photogates only had one beam and you had to calibrate the sensor to the specific size of the object moving through the beam.
Being able to instantly measure the velocity of a projectile before it flies through the air is extremely valuable in the application of this concept. While there are things I would do differently in the construction of the launchers, students were able to see how the different velocities and angles affect the range of the projectile. Once again, students predictions matched measured values closely and they were again amazed at the ability to see this difficult concept in action.
Inquiry. The buzzword of the day. How does it relate to science? Easy; it is science!
How to make it meaningful is the real question. How do we engage students and make it relevant to them? What can draw them in? What will impact them at a deeper level?
For me, it was car crashes. Momentum involves studying collisions and there are a lot of crashes with teens learning to drive. Add to the fact that my city is a giant hill and the lesson just kind of built itself. We would study materials to see what could protect you in the case of a crash.
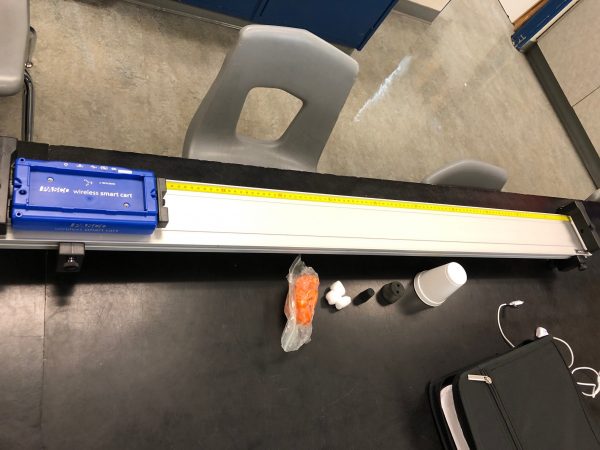
Smart Carts, SparkVue and a random assortment of materials. Styrofoam, rubber, cotton, what would work best? The students had preconceived ideas…perfect.
I turned them loose with the barest of hints. What are you worried about in a crash? What should we measure? What situations do we need to test?
They picked random materials and got to it. The discussions were great! Arguments about what to use, how to set it up, how to measure, what to measure. They looked to me to settle disputes and I said “Work it out yourselves. You can do this.” Here’s what they came up with.
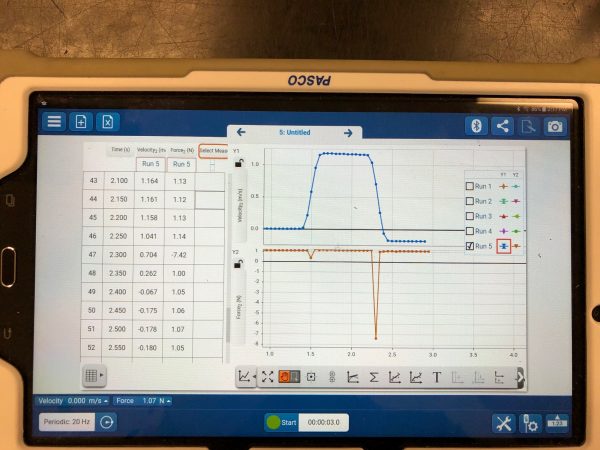
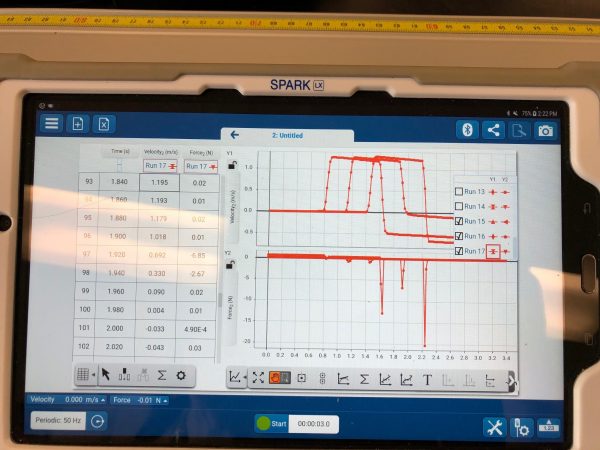
Doing the two graph setup measuring velocity vs time and force vs time they could identify when the collision took place easily. They could use the area of the force-time graph to calculate impulse.
The results surprised them. That lead to more questions. And that is what science, and inquiry, is all about.
Roseville, Calif., Jan. 7, 2020 /PRNewswire/ — PASCO Scientific announced today that it has joined the Google for Education Integrated Solutions Initiative. This collaboration integrates PASCO solutions with Google products to improve the efficiency of classroom experimentation and science learning.
PASCO Scientific has collaborated with Google throughout the development process to deliver users a fluid experience. “Teachers and students have been using SPARKvue to collect and analyze data on their Chromebooks and Android devices for years. Partnering with Google feels like a natural step forward in our mission to provide educators with a centralized solution for teaching science. We plan to continue improving global access to science education and data literacy alongside Google,” said Richard Briscoe, President and CEO of PASCO Scientific.
The Google for Education Integrated Solutions Initiative features education apps and tools optimized for integration with Chrome OS, Google Classroom, or G Suite for Education. PASCO’s more than 55 years of experience in science education has made them a well-known leader in STEM education and an ideal partner for the advancement of powerful teaching and learning solutions.
The first set of integrations with Google’s offerings include the ability to connect PASCO sensors to the Google Science Journal app on Android, export data directly to Google Sheets on Android, and easily share lab resources from PASCO.com through Google Classroom.
The partnership extends accessibility to educators by providing them with an affordable and compatible sensor solution. Science Journal app users will now enjoy the same plug-and-play sensor experience as SPARKvue users when using PASCO wireless sensors. A new “Share to Classroom” button exports digital experiments from the PASCO Experiment Library to courses setup in Google Classroom. This feature enables educators to export any of PASCO’s free experiments to their entire class with a single click.
Briscoe is confident in the partnership’s potential saying, “At PASCO, we are excited to be partnering with Google in our mission to promote accessible science learning and data literacy. We are consistently striving to provide educators with innovative teaching solutions that improve the efficiency of their classroom. Hundreds of thousands of learners around the world use Google Science Journal. By enabling PASCO sensors to work with Google Science Journal, we are expanding educators’ tools and helping students engage with science learning.”
For more information about the integration of PASCO solutions into Google products, please visit www.pasco.com/resources/google.
I’ve been teaching physics for years and for most of the years that meant one thing: ticker tape. Don’t get me wrong, there is a certain elegance to labs using ticker tape; there just isn’t as much depth. Enter the PASCO Smart Cart and SparkVue software.
I’ve had the carts for a few years now and I keep learning more things to do with them. I wanted students to go deeper into Newton’s laws but how could I do that with the Smart Carts and SparkVue? Here’s what I came up with.
I took my old set-up from the ticker tape days. Have a cart pulled across a table pulled by a hanging mass over a pulley. Change the amount of mass on the cart and the amount pulling the cart. Calculate the acceleration using kinematics. Compare the mass times the acceleration to the weight hanging over the edge.
That set-up is lowish friction, which we could hand-wave away, but I never liked doing that. If we used the carts on a track with the Super pulley would I get better results? Indeed, I did. Measured accelerations were within 10% of theoretical. Could I do better?
I attached the hook to the carts and used the force sensor to measure the tension pulling the cart. Using the data from the force sensor I got within 1% of expected values! This is great accuracy and a starting point for going deeper. Why does the force sensor start with the force of the hanging mass and then drop? Why does the force sensor data give better data then using the values of the hanging mass?
The old lab changed the mass on the cart and the mass hanging off the edge to compare the effects of changing the mass of the system or changing the force of the system. Good but not great. Now I can do the lab over the pulley or run the string through the end stop for increased friction. The students can compare different variations of the set up in the same amount of time it took with the ticker-tape.
With ticker-tape it took a long time and didn’t go very deep; basic understanding only. Now with the Smart Carts and SparkVue we can go deeper, quicker. Isn’t that what we are after? Critical thinking and deeper learning? PASCO’s products offer a chance for that and I am grateful for it.
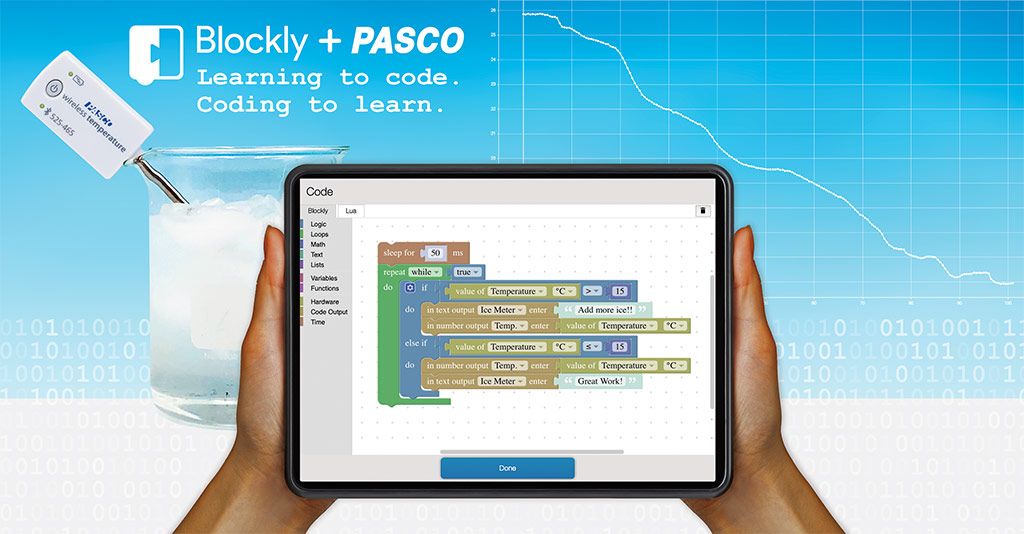
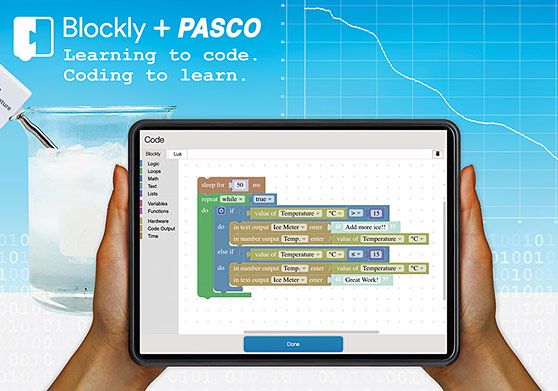
Confidently Integrate Computational Thinking into Any Lesson with Blockly
Introducing students to coding and computer-controlled outcomes is easier than ever before with Blockly coding. Included in SPARKvue 4 and Capstone 2, Blockly offers students a new world of experimental opportunities that focus on computational thinking and data visualization. Blockly’s visual coding environment is intuitively designed to facilitate the success of new coders, while strengthening the skills of more advanced learners.
Blockly’s colored coding blocks provide students with a visual method for developing strong coding foundations. The user-friendly design allows students to simply drag and connect coding blocks that correlate with syntactically correct coding elements such as variables, commands, and loops.
Blockly within SPARKvue and Capstone is compatible with all PASCO sensors and interfaces. When students combine PASCO sensors with Blockly, they are empowered to design and execute their very own sensor experiments. Students can create code that collects sensor measurements, reports data, or controls output devices such as the Smart Fan Accessory. As they execute their code, students can visualize their data using real-time graphical displays that assist with data visualization.
Real-World Coding Activities: Computational Thinking Meets Data Literacy
The integration of Blockly into SPARKvue and Capstone gives students unparalleled control over their experiments. While developing their code, students can press the Record button at any time to execute it and receive live feedback. Students can instantly monitor sensor measurements through live graphs and digits displays that support debugging throughout their code creation process. Once students have successfully coded their sensor parameters, they can collect data in real time, store it, and use it to inform future experiments.
With an unlimited amount of coding combinations, Blockly allows students to customize and create experimental designs, determine data outputs, and use those outputs to inform future decisions. Through the integration of coding and sensor-based technology, both SPARKvue and Capstone provide a platform for the exploration of phenomena through computational thinking and data visualization.
Sample Programming Activities
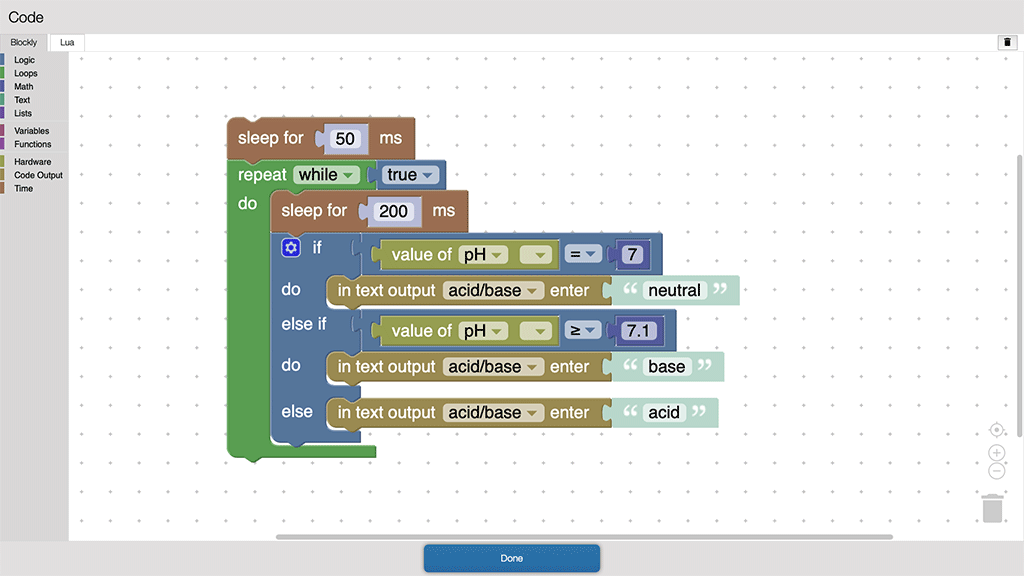
Entry Level Programming with the Wireless pH Sensor
The Wireless pH Sensor is the perfect tool for introducing young learners to pH and simple programming. In this activity, students use their knowledge of the pH scale and a Wireless pH Sensor to create code that runs along with their data collection. Using a simple set of coding blocks, students can instruct the sensor to identify a sample solution as neutral, basic, or acidic. As their code is executed, live data displays communicate the code’s effect in real time. A text display will correctly identify a solution’s pH. This simple activity gently introduces students to basic programming concepts, sensor measurement, and the pH scale to instill a foundational sense of confidence and understanding in STEM.
Instruct the sensor to identify a sample solution as neutral, basic, or acidic.A live data display communicates the code’s effect in real time.
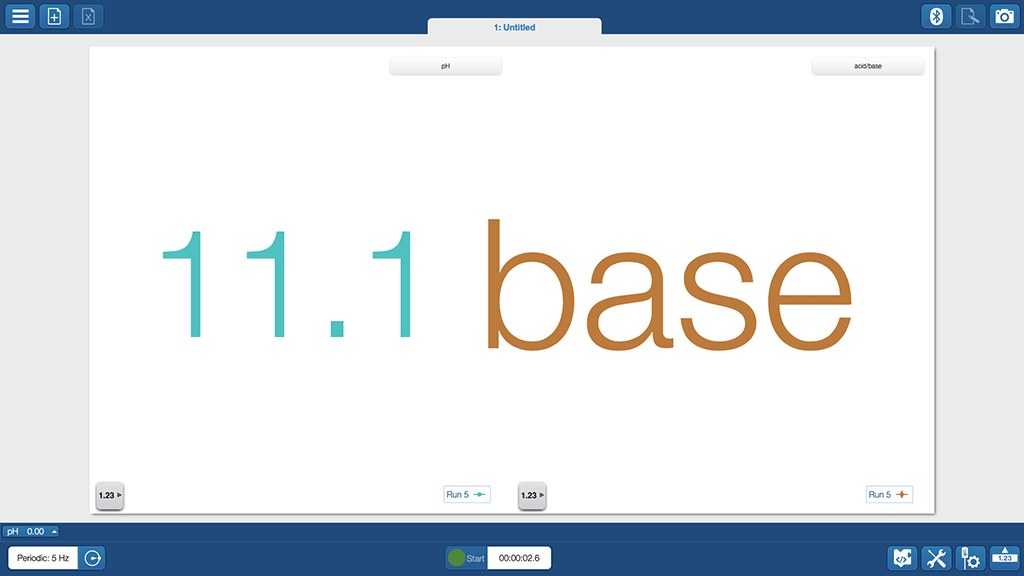
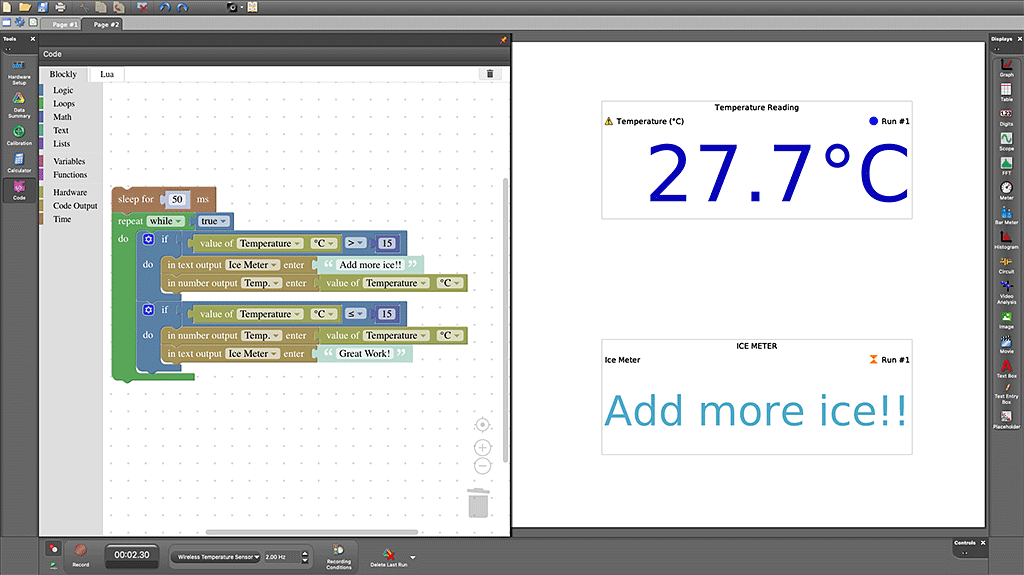
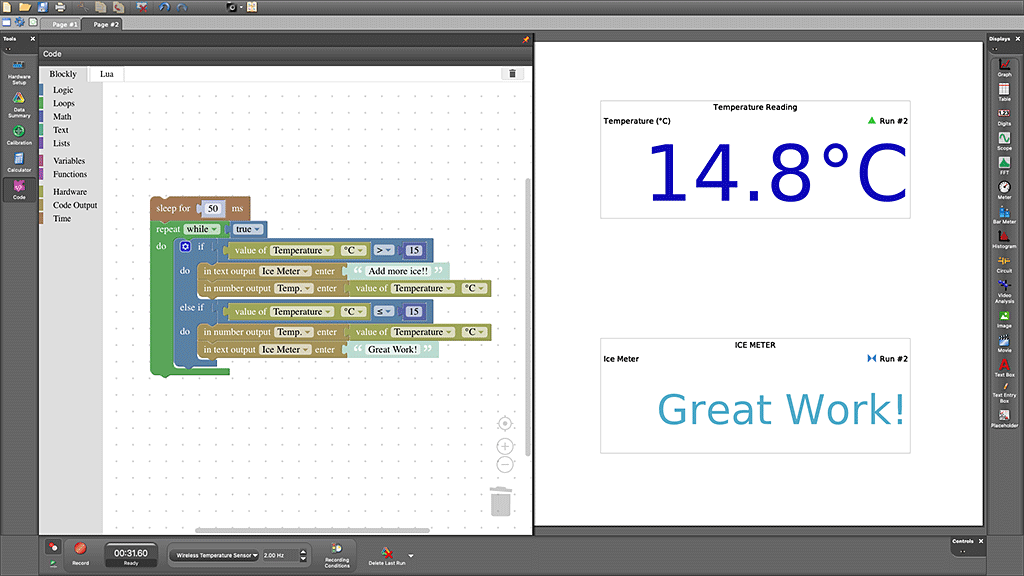
Entry Level Programming with the Wireless Temperature Sensor
For introductory lessons, students can learn to program a temperature display and a simple text output. The goal of this activity is for students to create a program that gives instructions to cool a liquid to below 15°C. Students can monitor their live temperature reading and a text output that is temperature-dependent. In this example, the text output reads “Add more ice!” when the water temperature is above 15°C, and “Great work!!” when the water temperature is less than or equal to 15°C. The Wireless Temperature Sensor should be placed in a cup containing room temperature water. Once students have developed their Blockly code, they can execute it using the Record button. Add the ice gradually to reduce the water temperature. A successful program will display a live temperature reading and the correct text when the temperature shifts above and below 15°C.
In this example, the text output reads “Add more ice!” when the water temperature is above 15°C.In this example, the text output reads “Great work!!” when the water temperature is less than or equal to 15°C.
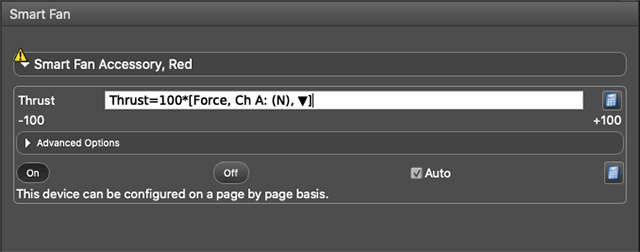
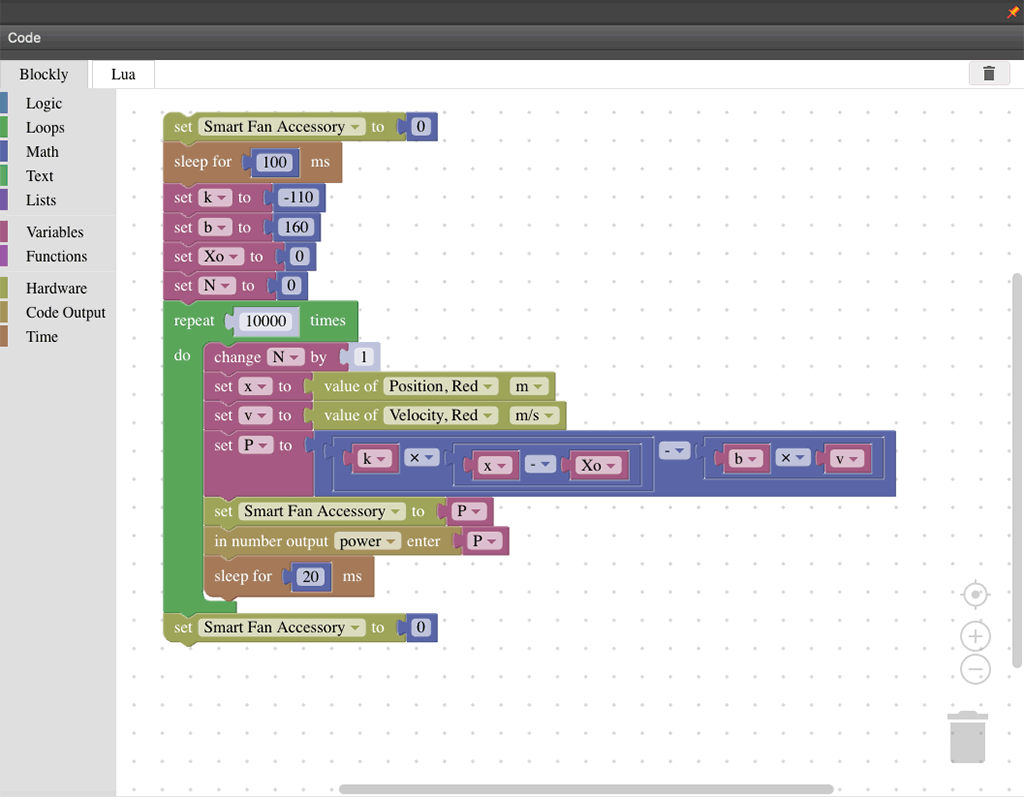
Advanced Level Programming: Thrust with Blockly and the Smart Fan Accessory
The patented Smart Fan Accessory adds versatility to any dynamics experiment. It features numerous control features when plugged into a Smart Cart. Students can control the fan’s thrust and direction from their devices. They can also set start and stop conditions that power the fan on or off when a particular measurement, such as position, reaches a set value. Students can easily determine a parameter and immediately observe its impact on the experimental outcome, which is a powerful component of active learning.
Students can control the fan’s thrust by programming calculations based on sensor measurements. In this example, a student commands the fan to maintain a thrust of -100*[Position]. This makes the fan blow harder as the cart moves down the track, causing the cart to reverse. When the fan senses a determined measurement, the student’s code is executed, producing a physical change in the experiment and altering data collection. Students can test their code’s effectiveness, make corrections, obtain live data, and complete graphical analysis before exporting their lab for grading. This user-friendly platform is an intuitive and time-efficient method for introducing students to computational thinking without straying from standards.
Control the fan’s thrust and direction from their devices.Control the fan’s thrust by programming calculations based on sensor measurements.
Blockly is Compatible with All PASCO Sensors & Interfaces
Organize and present collected data visually to highlight relationships and support a claim.
Use data to highlight or propose cause-and-effect relationships, predict outcomes, or communicate an idea.
Represent data using multiple encoding schemes.
Collect data using computational tools and transform the data to make it more useful and reliable.
Refine computational models based on the data they have generated.
Algorithms and Programming
Compare and refine multiple algorithms for the same task and determine which is the most appropriate.
Create programs that use variables to store and modify data.
Create programs that include sequences, events, loops, and conditionals.
Use an iterative process to plan the development of a program by including other perspectives and considering user preferences.
Test and debug (identify and fix errors) a program or algorithm to ensure it runs as intended.
Use flowcharts and/or pseudocode to address complex problems as algorithms.
Create clearly named variables that represent different data types and perform operations on their values.
Design and iteratively develop programs that combine control structure, including nested loops and compound conditionals.
Decompose problems and subproblems into parts to facilitate the design, implementation, and review of programs.
Computing Systems
Design projects that combine hardware and software components to collect and exchange data.
Motion and Stability: Forces and Interactions
Plan and conduct an investigation to provide evidence of the effects of balanced and unbalanced forces on the motion of an object.
Define a simple design problem that can be solved by applying scientific ideas about magnets.
Ask questions to determine cause and effect relationships of electric or magnetic interactions between two objects not in contact with each other.
Conduct an investigation and evaluate the experimental design to provide evidence that fields exist between objects exerting forces on each other even though the objects are not in contact.
Energy
Make observations to provide evidence that energy can be transferred from place to place by sound, light, heat, and electric currents.
Waves and Their Applications in Technologies for Information Transfer
Generate and compare multiple solutions that use patterns to transfer information.
Integrate qualitative scientific and technical information to support the claim that digitized signals are a more reliable way to encode and transmit information than analog signals.
Engineering Design
Generate and compare multiple possible solutions to a problem based on how well each is likely to meet the criteria and constraints of the problem.
Plan and carry out fair tests in which variables are controlled and failure points are considered to identify aspects of a model or prototype that can be improved.
Analyze data from tests to determine similarities and differences among several design solutions to identify the best characteristics of each that can be combined into a new solution to better meet the criteria for success.
Develop a model to generate data for iterative testing and modification of a proposed object, tool, or process such that an optimal design can be achieved.
Introducing students to coding and computer-controlled outcomes is easier than ever before with Blockly coding. Included in SPARKvue 4 and Capstone 2, Blockly offers students a new world of experimental opportunities that focus on computational thinking and data visualization. Blockly’s visual coding environment is intuitively designed to facilitate the success of new coders, while strengthening the skills of more advanced learners.
Blockly’s colored coding blocks provide students with a visual method for developing strong coding foundations. The user-friendly design allows students to simply drag and connect coding blocks that correlate with syntactically correct coding elements such as variables, commands, and loops.
Blockly within SPARKvue and Capstone is compatible with all PASCO sensors and interfaces. When students combine PASCO sensors with Blockly, they are empowered to design and execute their very own sensor experiments. Students can create code that collects sensor measurements, reports data, or controls output devices such as the Smart Fan Accessory. As they execute their code, students can visualize their data using real-time graphical displays that assist with data visualization.
Real-World Coding Activities: Computational Thinking Meets Data Literacy
The integration of Blockly into SPARKvue and Capstone gives students unparalleled control over their experiments. While developing their code, students can press the Record button at any time to execute it and receive live feedback. Students can instantly monitor sensor measurements through live graphs and digits displays that support debugging throughout their code creation process. Once students have successfully coded their sensor parameters, they can collect data in real time, store it, and use it to inform future experiments.
With an unlimited amount of coding combinations, Blockly allows students to customize and create experimental designs, determine data outputs, and use those outputs to inform future decisions. Through the integration of coding and sensor-based technology, both SPARKvue and Capstone provide a platform for the exploration of phenomena through computational thinking and data visualization.
Sample Programming Activities
Entry Level Programming with the Wireless pH Sensor
The Wireless pH Sensor is the perfect tool for introducing young learners to pH and simple programming. In this activity, students use their knowledge of the pH scale and a Wireless pH Sensor to create code that runs along with their data collection. Using a simple set of coding blocks, students can instruct the sensor to identify a sample solution as neutral, basic, or acidic. As their code is executed, live data displays communicate the code’s effect in real time. A text display will correctly identify a solution’s pH. This simple activity gently introduces students to basic programming concepts, sensor measurement, and the pH scale to instill a foundational sense of confidence and understanding in STEM.
Instruct the sensor to identify a sample solution as neutral, basic, or acidic.A live data display communicates the code’s effect in real time.
Entry Level Programming with the Wireless Temperature Sensor
For introductory lessons, students can learn to program a temperature display and a simple text output. The goal of this activity is for students to create a program that gives instructions to cool a liquid to below 15°C. Students can monitor their live temperature reading and a text output that is temperature-dependent. In this example, the text output reads “Add more ice!” when the water temperature is above 15°C, and “Great work!!” when the water temperature is less than or equal to 15°C. The Wireless Temperature Sensor should be placed in a cup containing room temperature water. Once students have developed their Blockly code, they can execute it using the Record button. Add the ice gradually to reduce the water temperature. A successful program will display a live temperature reading and the correct text when the temperature shifts above and below 15°C.
In this example, the text output reads “Add more ice!” when the water temperature is above 15°C.In this example, the text output reads “Great work!!” when the water temperature is less than or equal to 15°C.
Advanced Level Programming: Thrust with Blockly and the Smart Fan Accessory
The patented Smart Fan Accessory adds versatility to any dynamics experiment. It features numerous control features when plugged into a Smart Cart. Students can control the fan’s thrust and direction from their devices. They can also set start and stop conditions that power the fan on or off when a particular measurement, such as position, reaches a set value. Students can easily determine a parameter and immediately observe its impact on the experimental outcome, which is a powerful component of active learning.
Students can control the fan’s thrust by programming calculations based on sensor measurements. In this example, a student commands the fan to maintain a thrust of -100*[Position]. This makes the fan blow harder as the cart moves down the track, causing the cart to reverse. When the fan senses a determined measurement, the student’s code is executed, producing a physical change in the experiment and altering data collection. Students can test their code’s effectiveness, make corrections, obtain live data, and complete graphical analysis before exporting their lab for grading. This user-friendly platform is an intuitive and time-efficient method for introducing students to computational thinking without straying from standards.
Control the fan’s thrust and direction from their devices.Control the fan’s thrust by programming calculations based on sensor measurements.
Blockly is Compatible with All PASCO Sensors & Interfaces
5a Students formulate problem definitions suited for technology-assisted methods such as data analysis, abstract models and algorithmic thinking in exploring and finding solutions.
5b Students collect data or identify relevant data sets, use digital tools to analyze them, and represent data in various ways to facilitate problem-solving and decision-making.
5c Students break problems into component parts, extract key information, and develop descriptive models to understand complex systems or facilitate problem-solving.
5d Students understand how automation works and use algorithmic thinking to develop a sequence of steps to create and test automated solutions.
ISTE Standards Grades 3-5 (ages 8-11)
Data and Analysis
1B-DA-06 Organize and present collected data visually to highlight relationships and support a claim.
1B-DA-07 Use data to highlight or propose cause-and-effect relationships, predict outcomes, or communicate an idea.
Algorithms and Programming
1B-AP-08 Compare and refine multiple algorithms for the same task and determine which is the most appropriate.
1B-AP-09 Create programs that use variables to store and modify data.
1B-AP-10 Create programs that include sequences, events, loops, and conditionals.
1B-AP-13 Use an iterative process to plan the development of a program by including other perspectives and considering user preferences.
1B-AP-15 Test and debug (identify and fix errors) a program or algorithm to ensure it runs as intended.
ISTE Standards Grades 6-8 (ages 11-14)
Computing Systems
2-CS-02 Design projects that combine hardware and software components to collect and exchange data.
Data and Analysis
2-DA-07 Represent data using multiple encoding schemes.
2-DA-08 Collect data using computational tools and transform the data to make it more useful and reliable.
2-DA-09 Refine computational models based on the data they have generated.
Algorithms and Programming
2-AP-10 Use flowcharts and/or pseudocode to address complex problems as algorithms.
2-AP-11 Create clearly named variables that represent different data types and perform operations on their values.
2-AP-12 Design and iteratively develop programs that combine control structure, including nested loops and compound conditionals.
2-AP-13 Decompose problems and subproblems into parts to facilitate the design, implementation, and review of programs.
NGSS Alignment (Grades 3-5)
Motion and Stability: Forces and Interactions
3-PS2-1 Plan and conduct an investigation to provide evidence of the effects of balanced and unbalanced forces on the motion of an object.
3-PS2-4 Define a simple design problem that can be solved by applying scientific ideas about magnets.
Energy
4-PS3-2 Make observations to provide evidence that energy can be transferred from place to place by sound, light, heat, and electric currents.
Waves and Their Applications in Technologies for Information Transfer
4-PS4-3 Generate and compare multiple solutions that use patterns to transfer information.
Engineering Design
3-5-ETS1-2 Generate and compare multiple possible solutions to a problem based on how well each is likely to meet the criteria and constraints of the problem.
3-5-ETS1-3 Plan and carry out fair tests in which variables are controlled and failure points are considered to identify aspects of a model or prototype that can be improved.
NGSS Alignment (Grades 6-8)
Motion and Stability: Forces and Interactions
MS-PS2-3 Ask questions to determine cause and effect relationships of electric or magnetic interactions between two objects not in contact with each other.
MS-PS2-5 Conduct an investigation and evaluate the experimental design to provide evidence that fields exist between objects exerting forces on each other even though the objects are not in contact.
Waves and Their Applications in Technologies for Information Transfer
MS-PS4-3 Integrate qualitative scientific and technical information to support the claim that digitized signals are a more reliable way to encode and transmit information than analog signals.
Engineering Design
MS-ETS1-3 Analyze data from tests to determine similarities and differences among several design solutions to identify the best characteristics of each that can be combined into a new solution to better meet the criteria for success.
MS-ETS1-4 Develop a model to generate data for iterative testing and modification of a proposed object, tool, or process such that an optimal design can be achieved.
Transpiration is an important concept in both biology and environmental science, especially in terms of the role it plays in the water cycle. As water evaporates from the stoma of leaves water is pulled up (due to hydrogen bonding) through the xylem from the roots which have drawn the water from the surrounding soil.
Because transpiration is essentially an invisible process, a potometer is used to measure the rate of water lost to the air. The advantages that sensor technology makes in many investigations in biology and environmental science are that it allows students to see the data in real-time while greatly improving the accuracy and significantly decreasing the time needed to capture data.
Setting up a classic potometer with a Wireless Pressure Sensor is one example of how integrating sensors can improve the data collection process. With the included Leur connectors and tubing, all you need is a plant sample and optional stand with clamps to complete the lab. Students can choose from any plants available, but three general guidelines help ensure success. Students should choose a plant with
a woody stem/branch that will fit snuggly into the tubing, making it less prone to crushing and easier to setup.
relatively soft cuticle leaves because they generally have higher rates of transpiration and good stomatal density.
high leaf surface area (either large leaves or lots of leaflets) per stem/branch.
Insert the plant stem into the tubing as shown, making sure there are no bubbles in the tubing and that you have a few centimeters of air between the sensor and water. This can take a few tries to get right, and having a sink or tub to submerse the tubing in will help. The cohesion and adhesion of the water along with a slight positive pressure created when connecting the sensor will keep water out of the sensor even if a stand is not available.
Figure 1. Potometer Setup with Wireless Pressure Sensor
Data collection usually takes 5-10 minutes depending on the plant. For the control run (taken at room temp with ambient light) wait for a change of at least 5.0 kPa before stopping data collection. After the control run is complete, find the rate of transpiration in kPa/min using the curve fit tool and save this into a data table. Save the plants from each trial so the surface area can be calculated and the trial data normalized for comparison.
Figure 2. Sample data from control run at room temperature with ambient lighting.
Calculating surface area (SA) can be done using the tried and true method with graph paper, but if you have cameras and computers available students can also use ImageJ— a free image analysis tool from the National Institute of Health. This is a powerful software and the basics are pretty easy to master. The steps for conducting area and size calculations in ImageJ can be found in this blog article or on this video. Although not part of the PASCO software suite, this is another tool that eliminates some repetitive work from the procedure and let students focus on the data and analysis that support learning.
Figure 3. ImageJ program analyzing leaf SA from control trial.
When the SA is determined, add it to the data table in SPARKvue. A simple calculation provides the adjusted rate in kPa/Min/cm2. In subsequent trials, students can investigate the impact of environmental variables such as light intensity, humidity, temperature, and wind— or they can compare different species of plants.
Figure 4. Data analysis table with control and windy trial data.
You can download the sample data with the table formatted and calculations created. After students go through the procedure once they can easily iterate this setup to conduct their inquiry— where the true learning transpires!
Your Shopping Cart will be saved and you'll be given a link. You, or anyone with the link, can use it to retrieve your Cart at any time.
Back
Save & Share Cart
Your Shopping Cart will be saved with Product pictures and information, and Cart Totals. Then send it to yourself, or a friend, with a link to retrieve it at any time.
Your cart email sent successfully :)
Marie Claude Dupuis
I have taught grade 9 applied science, science and technology, grade 10 applied, regular and enriched science, grade 11 chemistry and physics for 33 years at Westwood Senior High School in Hudson Québec. I discovered the PASCO equipment in 2019 and it completely changed my life. I love to discover, produce experiments and share discoveries. I am looking forward to work with your team.
Christopher Sarkonak
Having graduated with a major in Computer Science and minors in Physics and Mathematics, I began my teaching career at Killarney Collegiate Institute in Killarney, Manitoba in 2009. While teaching Physics there, I decided to invest in PASCO products and approached the Killarney Foundation with a proposal about funding the Physics lab with the SPARK Science Learning System and sensors. While there I also started a tremendously successful new course that gave students the ability to explore their interests in science and consisted of students completing one project a month, two of which were to be hands-on experiments, two of which were to be research based, and the final being up to the student.
In 2011 I moved back to Brandon, Manitoba and started working at the school I had graduated from, Crocus Plains Regional Secondary School. In 2018 I finally had the opportunity to once again teach Physics and have been working hard to build the program. Being in the vocational school for the region has led to many opportunities to collaborate with our Electronics, Design Drafting, Welding, and Photography departments on highly engaging inter-disciplinary projects. I believe very strongly in showing students what Physics can look like and build lots of demonstrations and experiments for my classes to use, including a Reuben’s tube, an electromagnetic ring launcher, and Schlieren optics setup, just to name a few that have become fan favourites among the students in our building. At the end of my first year teaching Physics at Crocus Plains I applied for CERN’s International High School Teacher Programme and became the first Canadian selected through direct entry in the 21 years of the program. This incredible opportunity gave me the opportunity to learn from scientists working on the Large Hadron Collider and from CERN’s educational outreach team at the S’Cool Lab. Following this, I returned to Canada and began working with the Perimeter Institute, becoming part of their Teacher Network.
These experiences and being part of professional development workshops with the AAPT and the Canadian Light Source (CLS) this summer has given me the opportunity to speak to many Physics educators around the world to gain new insights into how my classroom evolves. As I work to build our program, I am exploring new ideas that see students take an active role in their learning, more inter-disciplinary work with departments in our school, the development of a STEM For Girls program in our building, and organizing participation in challenges from the ESA, the Students on the Beamline program from CLS, and our local science fair.
Meaghan Boudreau
Though I graduated with a BEd qualified to teach English and Social Studies, it just wasn’t meant to be. My first job was teaching technology courses at a local high school, a far cry from the English and Social Studies job I had envisioned myself in. I was lucky enough to stay in that position for over ten years, teaching various technology courses in grades 10-12, while also obtaining a Master of Education in Technology Integration and a Master of Education in Online Instructional Media.
You will notice what is absent from my bio is any background in science. In fact, I took the minimum amount of required science courses to graduate high school. Three years ago I switched roles and currently work as a Technology Integration Leader; supporting teachers with integrating technology into their pedagogy in connection with the provincial outcomes. All of our schools have PASCO sensors at some level (mostly grades 4-12) and I made it my professional goal to not only learn how to use them, but to find ways to make them more approachable for teachers with no formal science background (like me!). Having no background or training in science has allowed me to experience a renewed love of Science, making it easier for me to support teachers in learning how to use PASCO sensors in their classrooms. I wholeheartedly believe that if more teachers could see just how easy they are to use, the more they will use them in the classroom and I’ve made it my goal to do exactly that.
I enjoy coming up with out-of-the-box ways of using the sensors, including finding curriculum connections within subjects outside of the typical science realm. I have found that hands on activities with immediate feedback, which PASCO sensors provide, help students and teachers see the benefits of technology in the classroom and will help more students foster a love of science and STEAM learning.
Michelle Brosseau
I have been teaching since 2009 at my alma mater, Ursuline College Chatham. I studied Mathematics and Physics at the University of Windsor. I will have completed my Professional Master’s of Education through Queen’s University in 2019. My early teaching years had me teaching Math, Science and Physics, which has evolved into teaching mostly Physics in recent years. Some of my favourite topics are Astronomy, Optics and Nuclear Physics. I’ve crossed off many activities from my “Physics Teacher Bucket List”, most notably bungee jumping, skydiving, and driving a tank.
Project-based learning, inquiry-based research and experiments, Understanding by Design, and Critical Thinking are the frameworks I use for planning my courses. I love being able to use PASCO’s sensors to enhance the learning of my students, and make it even more quantitative.
I live in Chatham, Ontario with my husband and two sons.
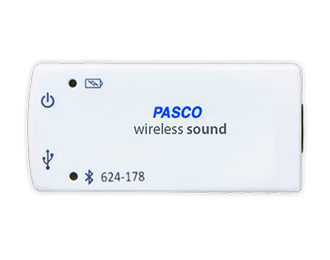 This is a wireless Bluetooth sensor that connects to any device loaded with either Sparkvue or Capstone software. As is the case with other Pasco wireless sensors this sensor is more powerful than the older sensor it replaces. It can be used to measure sound levels in decibels as well as to show the waveform of a sound in addition to an FFT display to show the frequencies present.
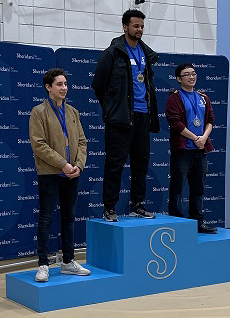 Sheridan College (Davis Campus) conducted their 3rd annual Skills Competition on March 4th, 2020, a day dedicated to recognize and celebrate the accomplishments of the students from various programs within the Faculty of Applied Science and Technology. Previously, professors selected their top students to compete in the Skills Ontario competition but with Sheridan’s new Skills Trade Centre, a more engaging way to select the students was brought forward.
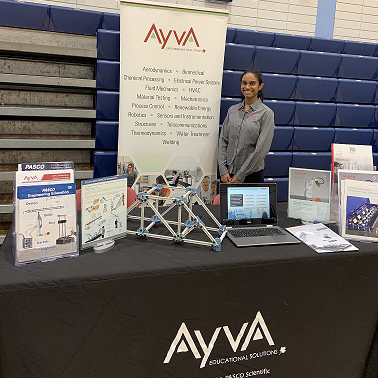 AYVA was proud to be a sponsor for this years’ event. It was an honour to be able to witness the extraordinary projects presented by the students.
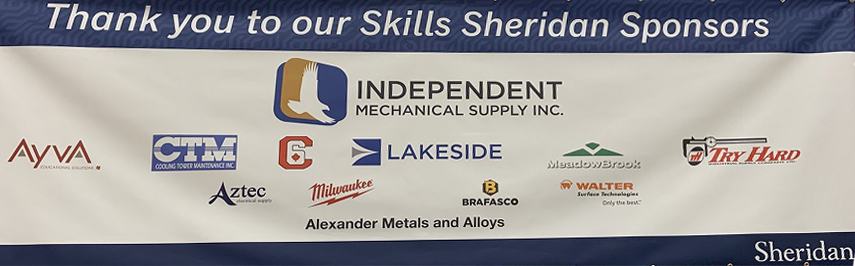
 I’ve been teaching physics for years and for most of the years that meant one thing: ticker tape. Don’t get me wrong, there is a certain elegance to labs using ticker tape; there just isn’t as much depth. Enter the PASCO Smart Cart and SparkVue software.